QUESTION IMAGE
Question
Question was provided via image upload.
Identify variables and relationship
Using the Independent and Dependent Variables knowledge point
- Independent variable: price of gasoline per gallon \(p\) (in dollars)
- Dependent variable: number of tourists in a national park \(t\) (in thousands or absolute count)
- Relationship: As the price of gasoline increases, travel costs rise, leading to a decrease in the number of tourists. Thus, \(t\) is a decreasing function of \(p\).
Analyze the axes of the graphs
- The prompt defines: Let \(p\) represent price of gasoline per gallon and \(t\) represent number of tourists.
- Therefore, the horizontal axis (independent variable) must be \(p\) (price of gasoline, in dollars), and the vertical axis (dependent variable) must be \(t\) (number of tourists).
- Looking at the options:
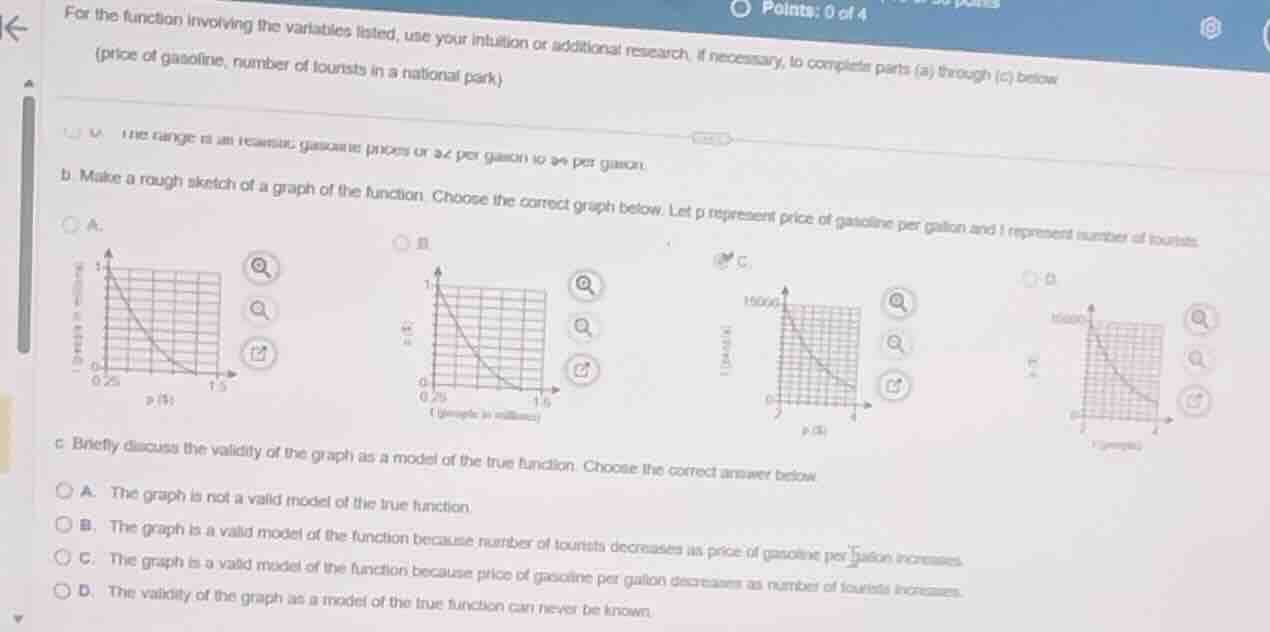
- Graph A: Vertical axis is labeled "t (people in millions)" and horizontal axis is \(p\) (\$).
- Graph B: Vertical axis is labeled \(p\) (\$) and horizontal axis is "t (people in millions)".
- Graph C: Vertical axis is labeled "t (tourists)" (with values up to 15000) and horizontal axis is \(p\) (\$).
- Graph D: Vertical axis is labeled \(p\) (\$) and horizontal axis is "t (people)".
- Since \(p\) is the independent variable, it must be on the horizontal axis, and \(t\) (tourists) must be on the vertical axis. This leaves Graph A and Graph C.
- A national park's tourist count is more realistically measured in thousands (e.g., up to 15,000 as in Graph C) rather than millions (as in Graph A, where 1 million tourists would be extremely high for a daily/weekly scale shown). Thus, Graph C is the correct representation.
Evaluate the validity of the model
- The graph shows a decreasing curve, meaning that as the price of gasoline increases, the number of tourists decreases.
- This is a valid economic model because higher fuel prices increase the cost of travel, which discourages people from visiting national parks.
- Therefore, the graph is a valid model because the number of tourists decreases as the price of gasoline per gallon increases.

Snap & solve any problem in the app
Get step-by-step solutions on Sovi AI
Photo-based solutions with guided steps
Explore more problems and detailed explanations
Question 1
- (A) Graph A
- (B) Graph B
- (C) Graph C (Correct answer)
- (D) Graph D
Question 2
- (A) The graph is not a valid model of the true function.
- (B) The graph is a valid model of the function because number of tourists decreases as price of gasoline per gallon increases. (Correct answer)
- (C) The graph is a valid model of the function because price of gasoline per gallon decreases as number of tourists increases.
- (D) The validity of the graph as a model of the true function can never be known.