QUESTION IMAGE
Question
Question was provided via image upload.
Analyze the distribution shape
Using the Data Distribution Shape knowledge point
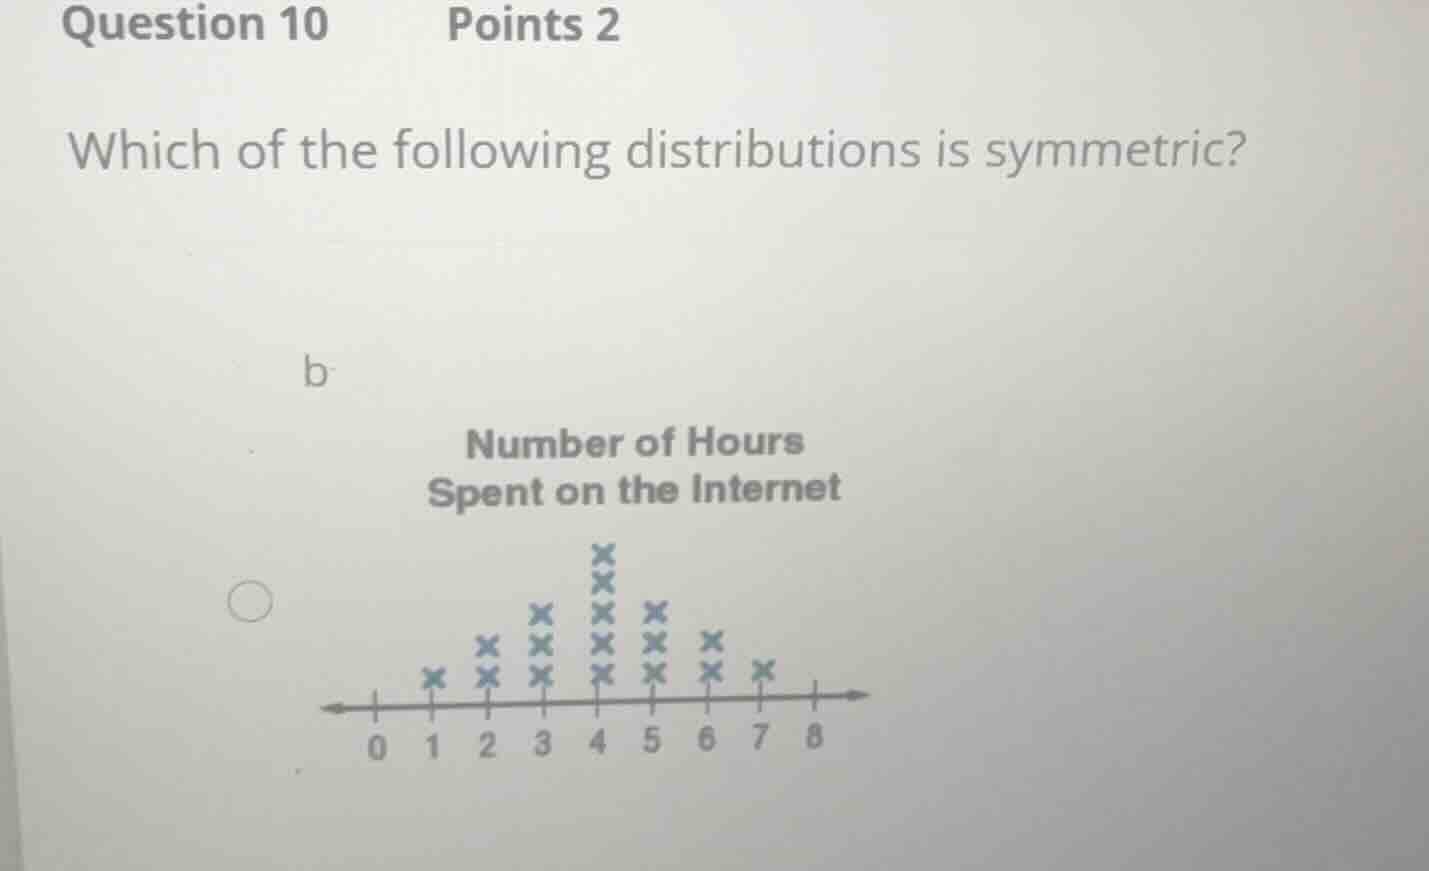
A distribution is symmetric if its left half is a mirror image of its right half. Let us count the data points (represented by 'x' marks) at each value on the horizontal axis:
- \(1\): 1 point
- \(2\): 2 points
- \(3\): 3 points
- \(4\): 5 points
- \(5\): 3 points
- \(6\): 2 points
- \(7\): 1 point
Verify symmetry about the center
Using the Data Distribution Shape knowledge point
The center of this distribution is at \(4\). Let us compare the frequencies at equal distances from the center:
- At distance 1: Frequencies at \(3\) and \(5\) are both 3.
- At distance 2: Frequencies at \(2\) and \(6\) are both 2.
- At distance 3: Frequencies at \(1\) and \(7\) are both 1.
Since the frequencies match perfectly on both sides of the center, this distribution is symmetric.

Snap & solve any problem in the app
Get step-by-step solutions on Sovi AI
Photo-based solutions with guided steps
Explore more problems and detailed explanations
- (b) Number of Hours Spent on the Internet (symmetric dot plot centered at 4) (Correct answer)