QUESTION IMAGE
Question
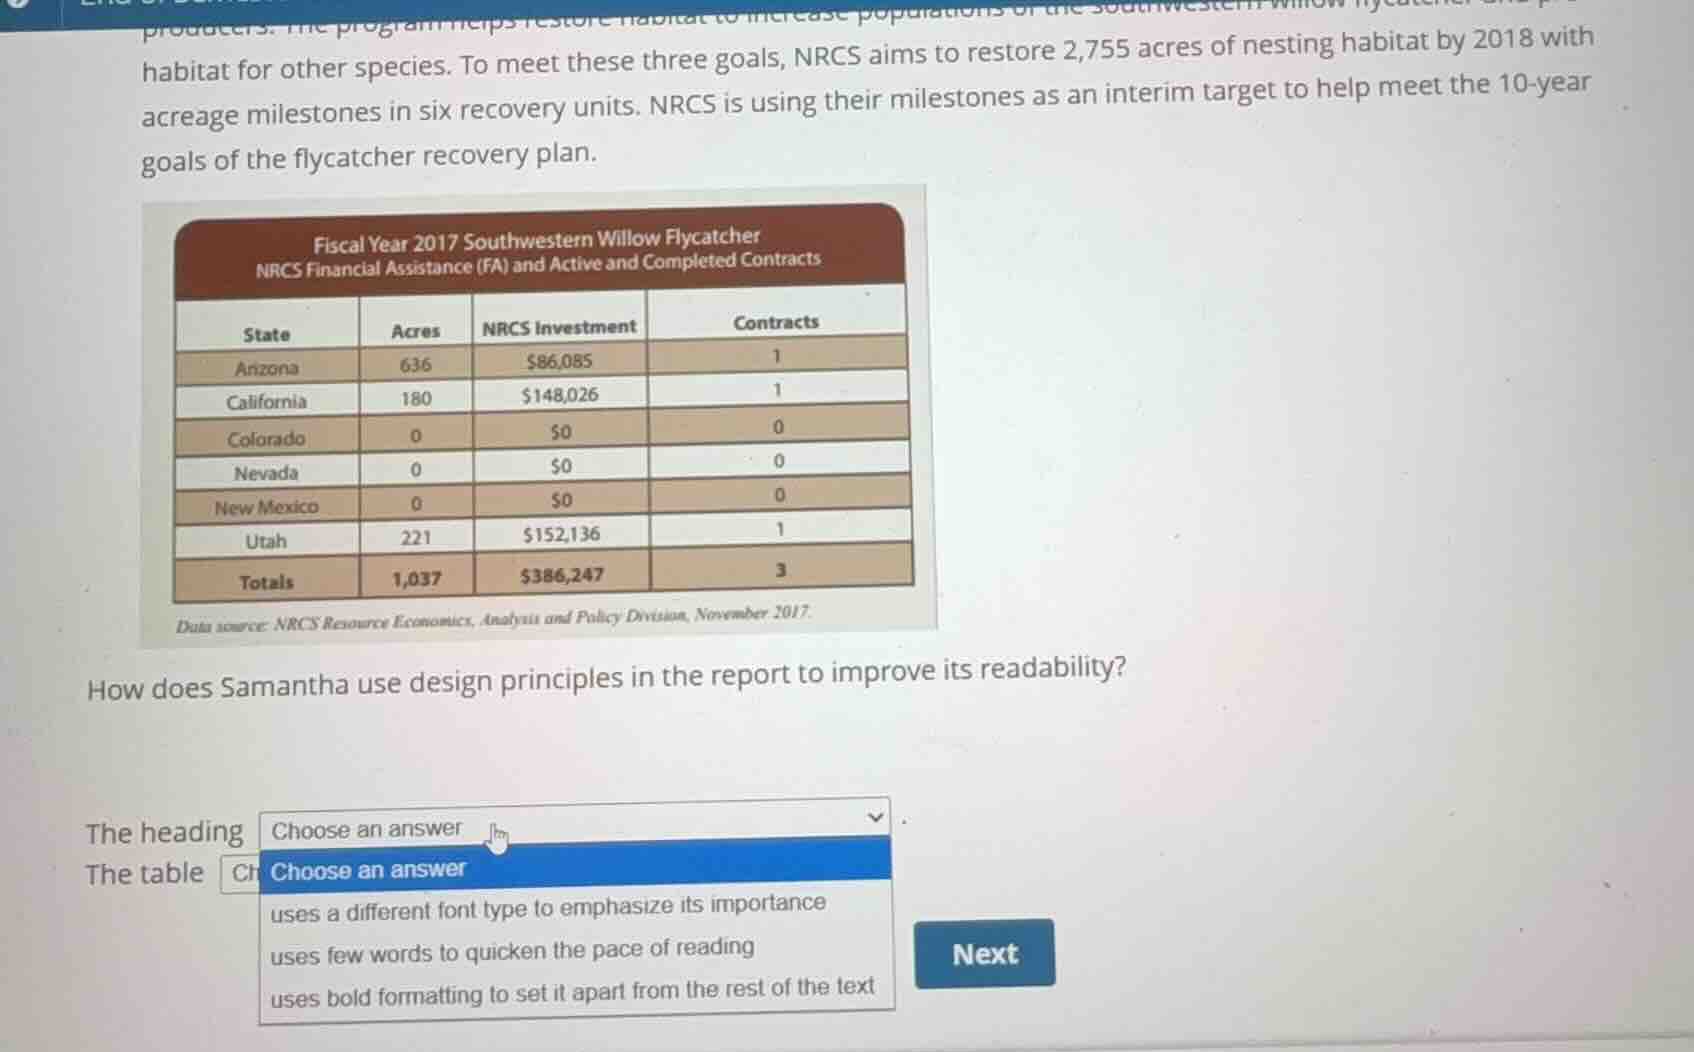
habitat for other species. to meet these three goals, nrcs aims to restore 2,755 acres of nesting habitat by 2018 with acreage milestones in six recovery units. nrcs is using their milestones as an interim target to help meet the 10-year goals of the flycatcher recovery plan.
how does samantha use design principles in the report to improve its readability?
the heading choose an answer
the table choose an answer
- uses a different font type to emphasize its importance
- uses few words to quicken the pace of reading
- uses bold formatting to set it apart from the rest of the text
<pre_analysis>
{
"quality": "clear",
"question_count": 2,
"skills_matched": [
"direct_cot",
"explain_then_answer",
"tutor"
],
"needs_drawing": false,
"concepts_used": [
"Visual Design Principles",
"Document Layout"
],
"new_concepts": [
"Document Typography",
"Information Chunking"
],
"current_concepts": [
"Visual Design Principles",
"Document Layout",
"Document Typography",
"Information Chunking"
]
}
</pre_analysis>
<reasoning>
Analyze the heading design
The question asks how Samantha uses design principles in the report to improve its readability, specifically focusing on "The heading" and "The table".
Looking at the image, the heading of the table is "Fiscal Year 2017 Southwestern Willow Flycatcher NRCS Financial Assistance (FA) and Active and Completed Contracts". This heading is set inside a dark brown banner with white text. In the dropdown options for "The heading", we see:
- "uses a different font type to emphasize its importance"
- "uses few words to quicken the pace of reading"
- "uses bold formatting to set it apart from the rest of the text"
In professional document design and Visual Design Principles, headings are styled distinctly to establish a visual hierarchy. The heading in the table uses bold white text on a dark background, which is a classic application of bold formatting and high contrast to set it apart from the rest of the body text. Therefore, the heading "uses bold formatting to set it apart from the rest of the text".
Analyze the table design
Next, we analyze the design of the table itself. Tables are a key element of Document Layout used to organize complex numerical data.
By presenting the state-by-state breakdown of acres, investments, and contracts in a structured grid rather than a dense paragraph of text, the table allows readers to scan and comprehend the data quickly.
The dropdown options visible in the image include:
- "uses a different font type to emphasize its importance"
- "uses few words to quicken the pace of reading"
- "uses bold formatting to set it apart from the rest of the text"
For a table, presenting data in structured columns and rows with concise labels "uses few words to quicken the pace of reading" compared to narrative text. This aligns with the core purpose of using tables in technical reports to present data efficiently and improve readability.
</reasoning>
<answer>
Question 1
The heading <blank>uses bold formatting to set it apart from the rest of the text</blank>
Question 2
The table <blank>uses few words to quicken the pace of reading</blank>
</answer>
<post_analysis>
{
"subject": "Others",
"question_type": "Fill-in-the-blank",
"knowledge_point": [
"Others",
"Professional Communication",
"Visual Design Principles"
]
}
</post_analysis>

Snap & solve any problem in the app
Get step-by-step solutions on Sovi AI
Photo-based solutions with guided steps
Explore more problems and detailed explanations
<pre_analysis>
{
"quality": "clear",
"question_count": 2,
"skills_matched": [
"direct_cot",
"explain_then_answer",
"tutor"
],
"needs_drawing": false,
"concepts_used": [
"Visual Design Principles",
"Document Layout"
],
"new_concepts": [
"Document Typography",
"Information Chunking"
],
"current_concepts": [
"Visual Design Principles",
"Document Layout",
"Document Typography",
"Information Chunking"
]
}
</pre_analysis>
<reasoning>
Analyze the heading design
The question asks how Samantha uses design principles in the report to improve its readability, specifically focusing on "The heading" and "The table".
Looking at the image, the heading of the table is "Fiscal Year 2017 Southwestern Willow Flycatcher NRCS Financial Assistance (FA) and Active and Completed Contracts". This heading is set inside a dark brown banner with white text. In the dropdown options for "The heading", we see:
- "uses a different font type to emphasize its importance"
- "uses few words to quicken the pace of reading"
- "uses bold formatting to set it apart from the rest of the text"
In professional document design and Visual Design Principles, headings are styled distinctly to establish a visual hierarchy. The heading in the table uses bold white text on a dark background, which is a classic application of bold formatting and high contrast to set it apart from the rest of the body text. Therefore, the heading "uses bold formatting to set it apart from the rest of the text".
Analyze the table design
Next, we analyze the design of the table itself. Tables are a key element of Document Layout used to organize complex numerical data.
By presenting the state-by-state breakdown of acres, investments, and contracts in a structured grid rather than a dense paragraph of text, the table allows readers to scan and comprehend the data quickly.
The dropdown options visible in the image include:
- "uses a different font type to emphasize its importance"
- "uses few words to quicken the pace of reading"
- "uses bold formatting to set it apart from the rest of the text"
For a table, presenting data in structured columns and rows with concise labels "uses few words to quicken the pace of reading" compared to narrative text. This aligns with the core purpose of using tables in technical reports to present data efficiently and improve readability.
</reasoning>
<answer>
Question 1
The heading <blank>uses bold formatting to set it apart from the rest of the text</blank>
Question 2
The table <blank>uses few words to quicken the pace of reading</blank>
</answer>
<post_analysis>
{
"subject": "Others",
"question_type": "Fill-in-the-blank",
"knowledge_point": [
"Others",
"Professional Communication",
"Visual Design Principles"
]
}
</post_analysis>