QUESTION IMAGE
Question
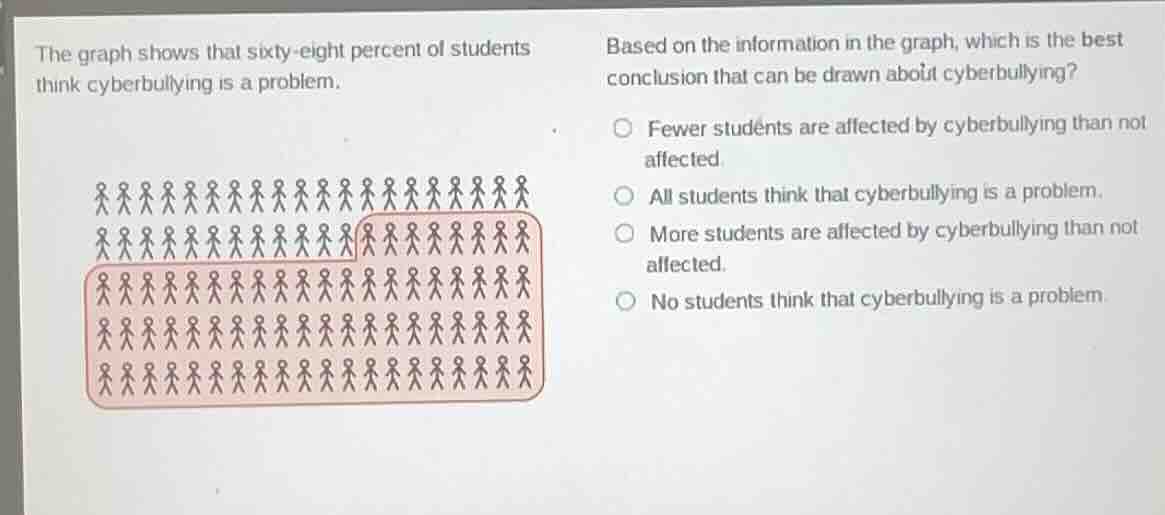
the graph shows that sixty - eight percent of students think cyberbullying is a problem.
based on the information in the graph, which is the best conclusion that can be drawn about cyberbullying?
○ fewer students are affected by cyberbullying than not affected.
○ all students think that cyberbullying is a problem.
○ more students are affected by cyberbullying than not affected.
○ no students think that cyberbullying is a problem.
We know 68% of students think cyberbullying is a problem, meaning the percentage of students affected (or who think it's a problem) is 68%, and those not affected would be \(100\% - 68\%=32\%\). Since \(68\%>32\%\), more students are affected by cyberbullying than not affected. The other options are incorrect: "Fewer..." is wrong as 68% > 32%; "All students..." is wrong as only 68% think so; "No students..." is wrong as 68% do think it's a problem.

Snap & solve any problem in the app
Get step-by-step solutions on Sovi AI
Photo-based solutions with guided steps
Explore more problems and detailed explanations
C. More students are affected by cyberbullying than not affected.