QUESTION IMAGE
Question
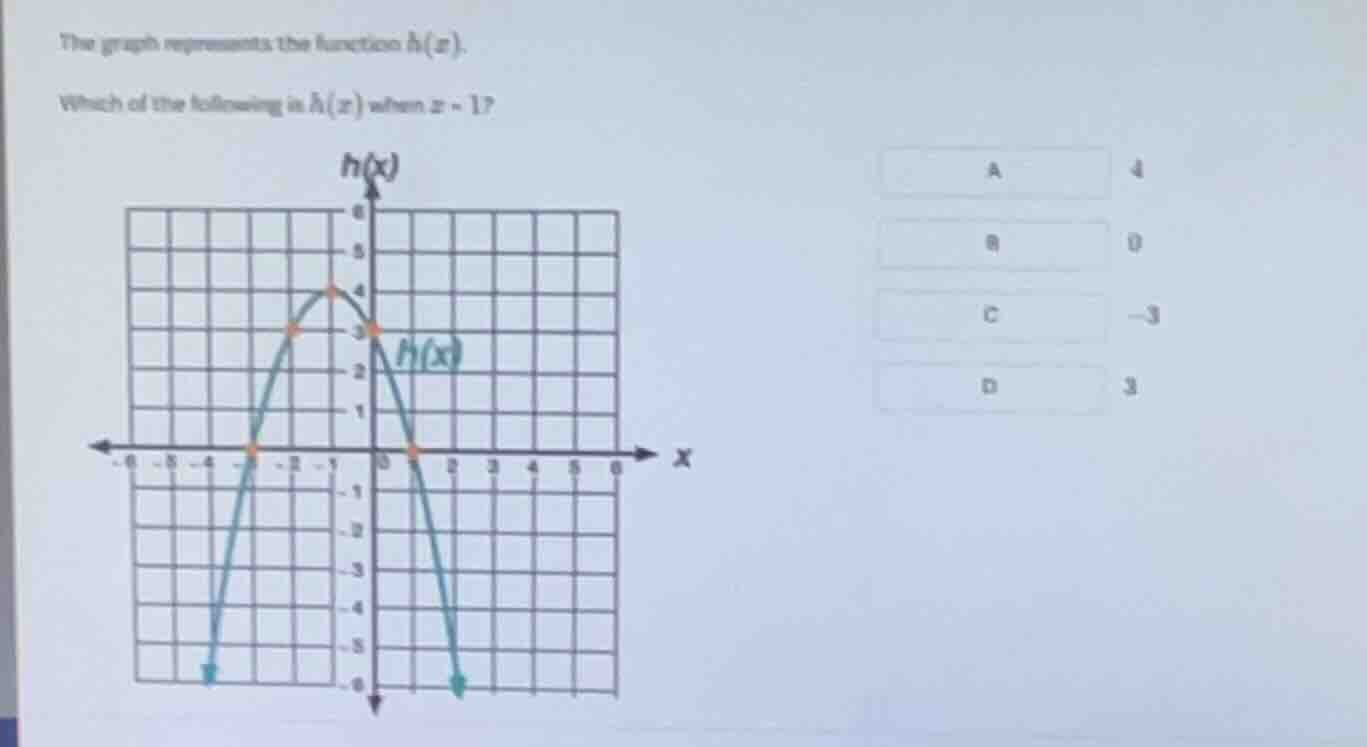
the graph represents the function (h(x)).
which of the following is (h(x)) when (x = 1)?
a: 4
b: 0
c: -3
d: 3
🆕 New Concept Discovered: Evaluating Functions from Graphs
Finding the output value on the vertical axis for a given input on the horizontal axis.
Step 1: Identify the input value
The problem asks for the value of \( h(x) \) when \( x = -1 \). This means we need to find the function's output, or \( y \)-value, corresponding to the input \( x = -1 \) on the horizontal axis.
Step 2: Locate the point on the graph
- Find \( -1 \) on the horizontal \( x \)-axis.
- Move vertically to find the point where the curve of the function \( h(x) \) lies at this \( x \)-coordinate.
- Looking at the graph, at \( x = -1 \), there is a plotted orange point at the peak (vertex) of the parabola.
- Read the corresponding value on the vertical \( h(x) \)-axis (the \( y \)-axis) for this point, which is \( 4 \).
Therefore, \( h(-1) = 4 \).

Snap & solve any problem in the app
Get step-by-step solutions on Sovi AI
Photo-based solutions with guided steps
Explore more problems and detailed explanations
A (which corresponds to the value 4)