QUESTION IMAGE
Question
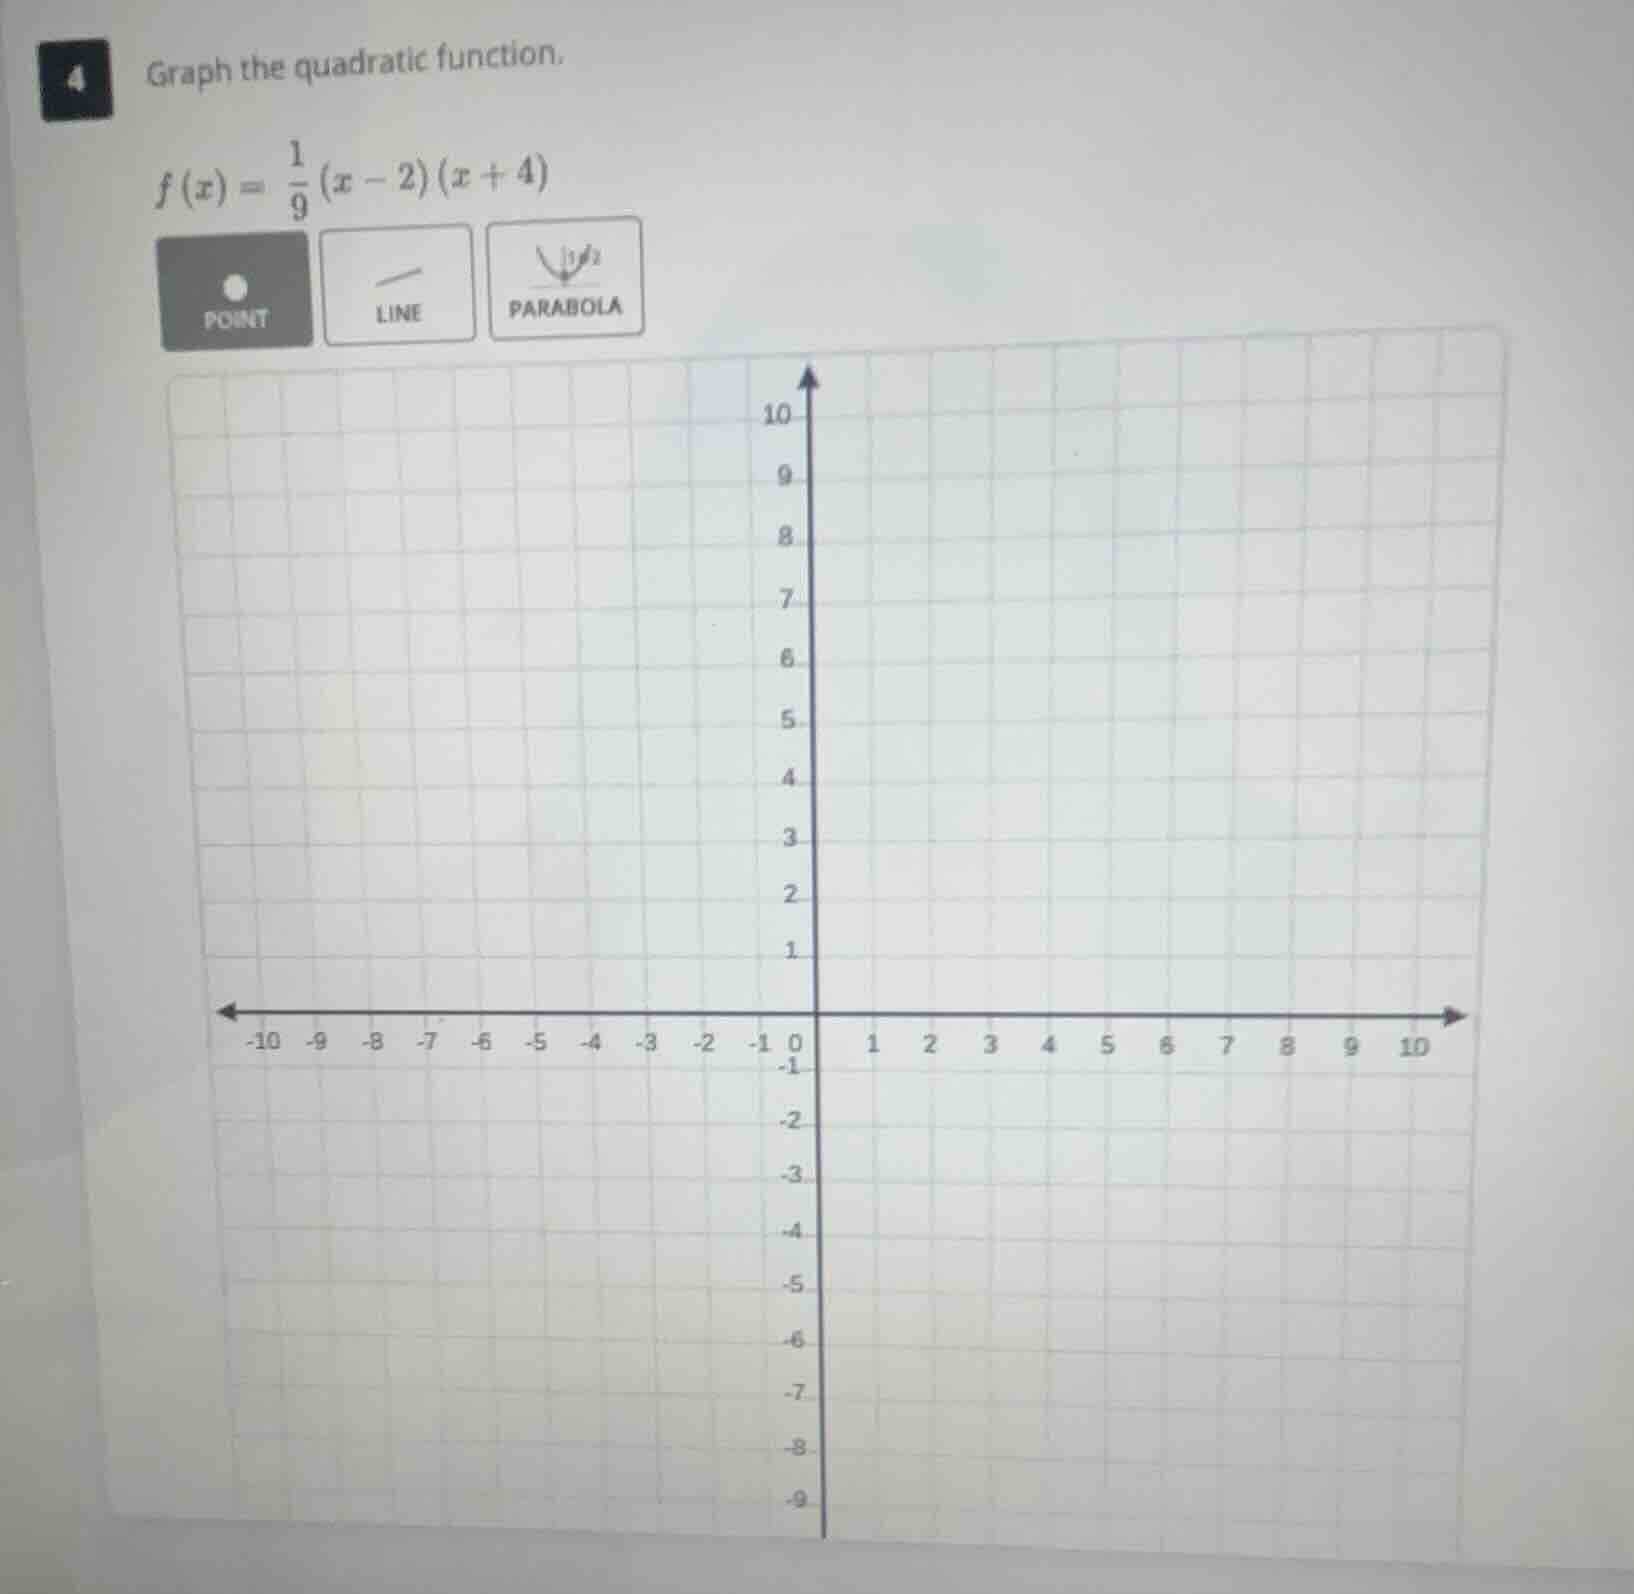
4 graph the quadratic function.
\\f(x) = \frac{1}{9}(x - 2)(x + 4)\\
⚡ Using what you learned: graphing quadratic functions
Step 1: Find the x-intercepts
The quadratic function is given in factored form:
\[ f(x) = \frac{1}{9}(x - 2)(x + 4) \]
Set \( f(x) = 0 \) to find the \( x \)-intercepts:
\[ x - 2 = 0 \implies x = 2 \]
\[ x + 4 = 0 \implies x = -4 \]
The \( x \)-intercepts are at the points \( (2, 0) \) and \( (-4, 0) \).
Step 2: Find the vertex
The \( x \)-coordinate of the vertex is halfway between the two \( x \)-intercepts:
\[ x_v = \frac{2 + (-4)}{2} = \frac{-2}{2} = -1 \]
Substitute \( x = -1 \) back into the function to find the \( y \)-coordinate of the vertex:
\[ f(-1) = \frac{1}{9}(-1 - 2)(-1 + 4) \]
\[ f(-1) = \frac{1}{9}(-3)(3) \]
\[ f(-1) = \frac{1}{9}(-9) = -1 \]
The vertex is at the point \( (-1, -1) \).
Step 3: Identify key points to plot
To graph the parabola, plot the following key points on the coordinate plane:
- Vertex: \( (-1, -1) \)
- x-intercepts: \( (2, 0) \) and \( (-4, 0) \)

Snap & solve any problem in the app
Get step-by-step solutions on Sovi AI
Photo-based solutions with guided steps
Explore more problems and detailed explanations
To graph the quadratic function:
- Select the PARABOLA tool.
- Plot the vertex at \( (-1, -1) \).
- Plot another point on the curve, such as one of the \( x \)-intercepts at \( (2, 0) \) or \( (-4, 0) \), to define the shape of the parabola opening upwards.