QUESTION IMAGE
Question
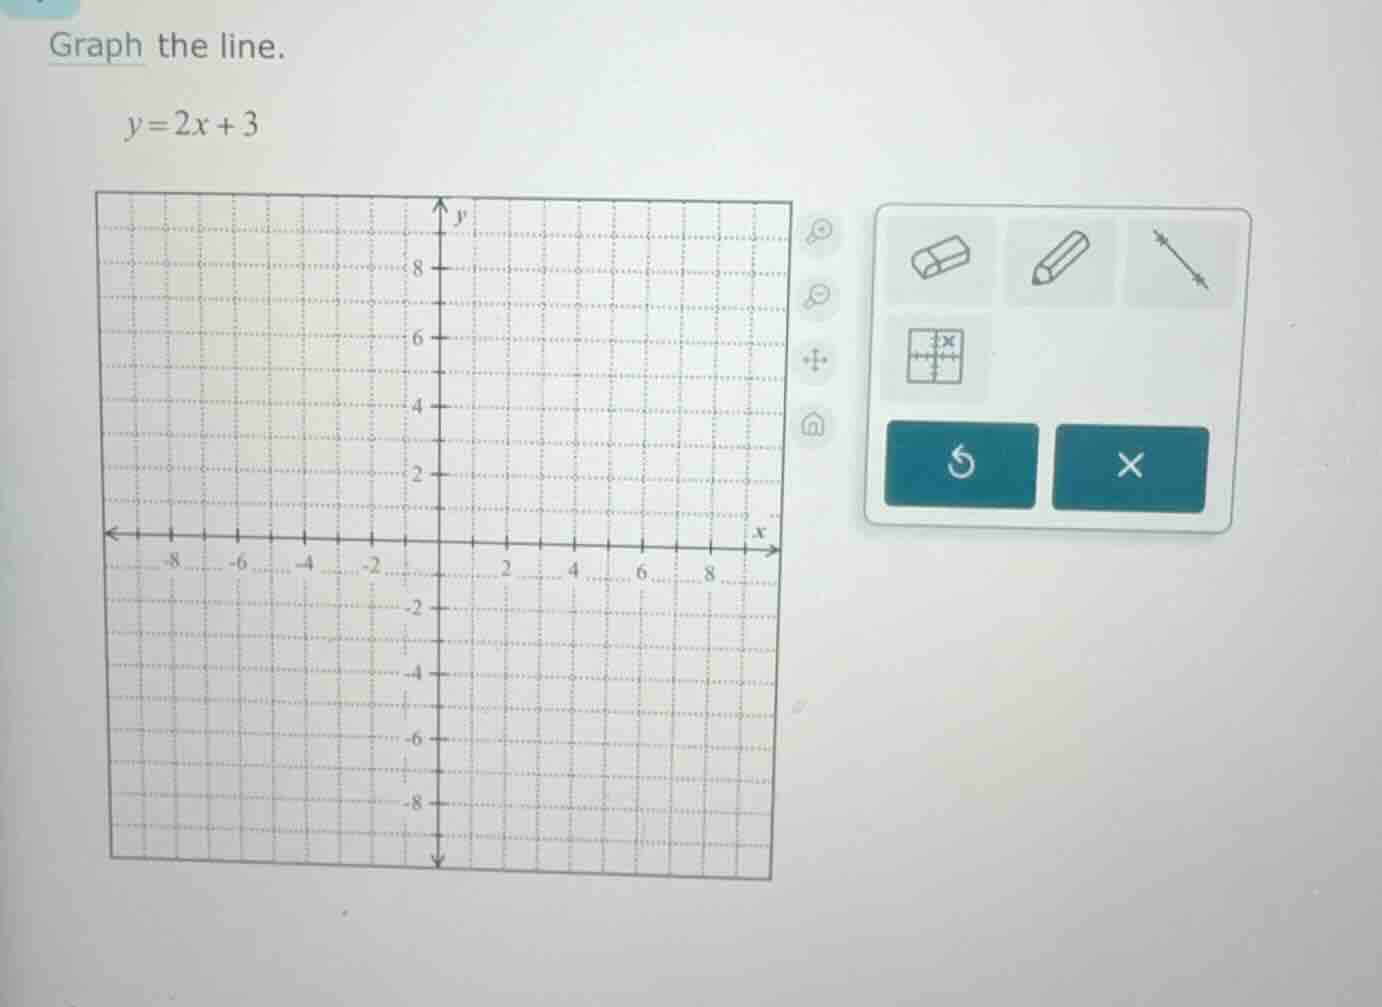
graph the line.
\\(y = 2x + 3\\)
<pre_analysis>
{
"quality": "clear",
"question_count": 1,
"skills_matched": [
"step_cot",
"explain_then_answer",
"quick"
],
"needs_drawing": true,
"concepts_used": [
"Graphing Linear Equations",
"Slope-Intercept Form"
],
"new_concepts": [],
"current_concepts": [
"Graphing Linear Equations",
"Slope-Intercept Form",
"Coordinate Plotting"
]
}
</pre_analysis>
<reasoning>
Identify the y-intercept
\[
\]
Find a second point using the slope
\[
\]
Verify with another point
\[
\]
</reasoning>
<answer>
To graph the line \(y = 2x + 3\), plot the y-intercept at \((0, 3)\) and use the slope of \(2\) to plot a second point at \((1, 5)\) or \((-1, 1)\), then draw a straight line passing through these points.
</answer>
<plot>
{
"elements": [
{
"type": "point",
"params": [[0, 3]],
"properties": {
"name": "y-intercept (0, 3)",
"size": 4,
"color": "#8C55F2",
"withLabel": true
}
},
{
"type": "point",
"params": [[1, 5]],
"properties": {
"name": "(1, 5)",
"size": 4,
"color": "#8C55F2",
"withLabel": true
}
},
{
"type": "line",
"params": [[0, 3], [1, 5]],
"properties": {
"strokeColor": "#5583F2",
"strokeWidth": 3
}
}
]
}
</plot>
<post_analysis>
{
"subject": "Mathematics",
"question_type": "Free Response",
"knowledge_point": [
"Mathematics",
"Geometry",
"Graphing Linear Equations"
]
}
</post_analysis>

Snap & solve any problem in the app
Get step-by-step solutions on Sovi AI
Photo-based solutions with guided steps
Explore more problems and detailed explanations
<pre_analysis>
{
"quality": "clear",
"question_count": 1,
"skills_matched": [
"step_cot",
"explain_then_answer",
"quick"
],
"needs_drawing": true,
"concepts_used": [
"Graphing Linear Equations",
"Slope-Intercept Form"
],
"new_concepts": [],
"current_concepts": [
"Graphing Linear Equations",
"Slope-Intercept Form",
"Coordinate Plotting"
]
}
</pre_analysis>
<reasoning>
Identify the y-intercept
\[
\]
Find a second point using the slope
\[
\]
Verify with another point
\[
\]
</reasoning>
<answer>
To graph the line \(y = 2x + 3\), plot the y-intercept at \((0, 3)\) and use the slope of \(2\) to plot a second point at \((1, 5)\) or \((-1, 1)\), then draw a straight line passing through these points.
</answer>
<plot>
{
"elements": [
{
"type": "point",
"params": [[0, 3]],
"properties": {
"name": "y-intercept (0, 3)",
"size": 4,
"color": "#8C55F2",
"withLabel": true
}
},
{
"type": "point",
"params": [[1, 5]],
"properties": {
"name": "(1, 5)",
"size": 4,
"color": "#8C55F2",
"withLabel": true
}
},
{
"type": "line",
"params": [[0, 3], [1, 5]],
"properties": {
"strokeColor": "#5583F2",
"strokeWidth": 3
}
}
]
}
</plot>
<post_analysis>
{
"subject": "Mathematics",
"question_type": "Free Response",
"knowledge_point": [
"Mathematics",
"Geometry",
"Graphing Linear Equations"
]
}
</post_analysis>