QUESTION IMAGE
Question
the graph of a function is given. determine whether the function is increasing, decreasing, or constant on the given interval.
0,1
Identify the interval on the x-axis
Using the Graph Analysis knowledge point
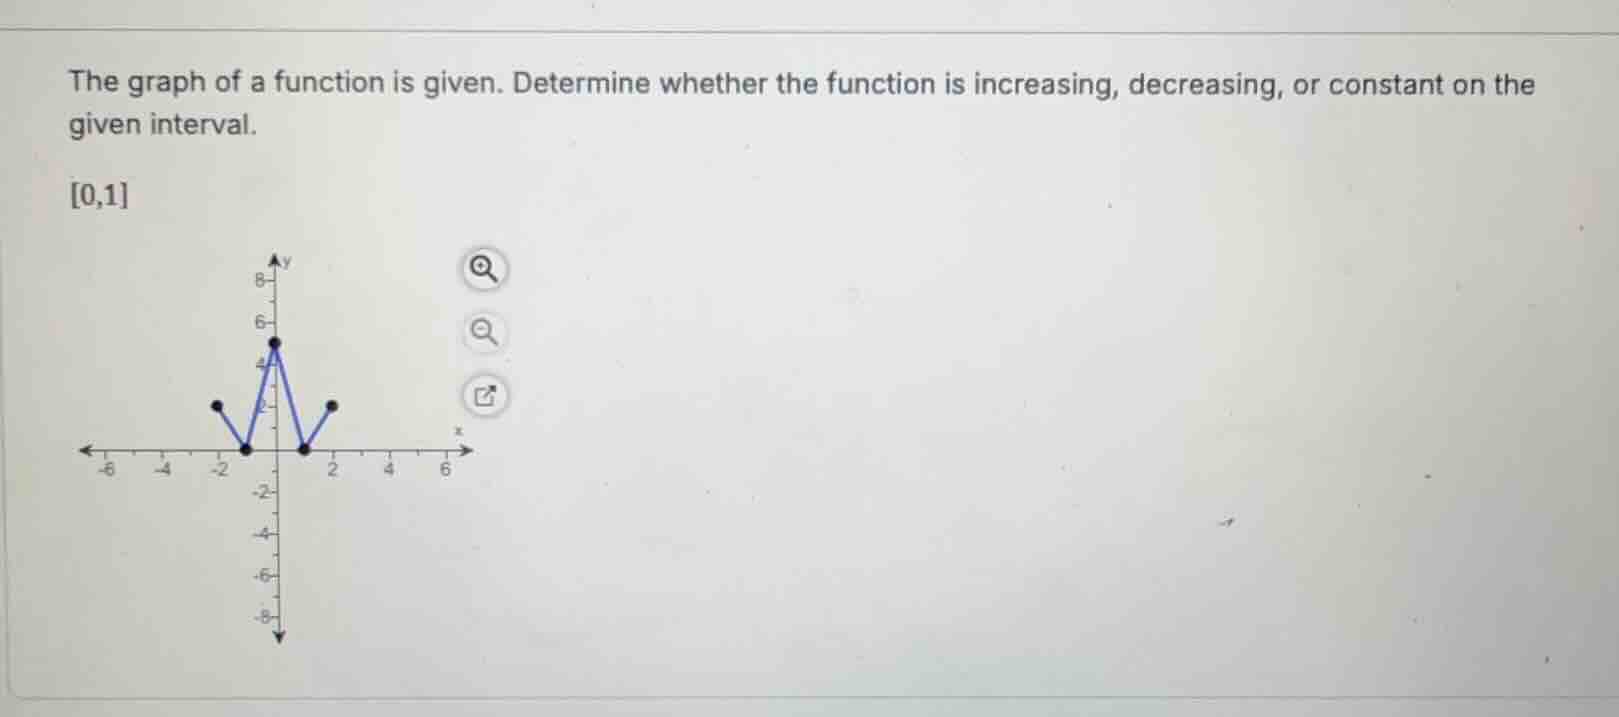
The given interval is \([0, 1]\), which represents the region on the horizontal axis from \(x = 0\) to \(x = 1\).
Analyze the behavior of the graph
Using the Intervals of Increase and Decrease knowledge point
- At \(x = 0\), the graph has a local maximum at the point \((0, 5)\).
- At \(x = 1\), the graph reaches a local minimum at the point \((1, 0)\).
- As \(x\) moves from \(0\) to \(1\), the curve moves downwards from \(y = 5\) to \(y = 0\).
- Since the \(y\)-values decrease as \(x\) increases, the function is decreasing on this interval.

Snap & solve any problem in the app
Get step-by-step solutions on Sovi AI
Photo-based solutions with guided steps
Explore more problems and detailed explanations
decreasing