QUESTION IMAGE
Question
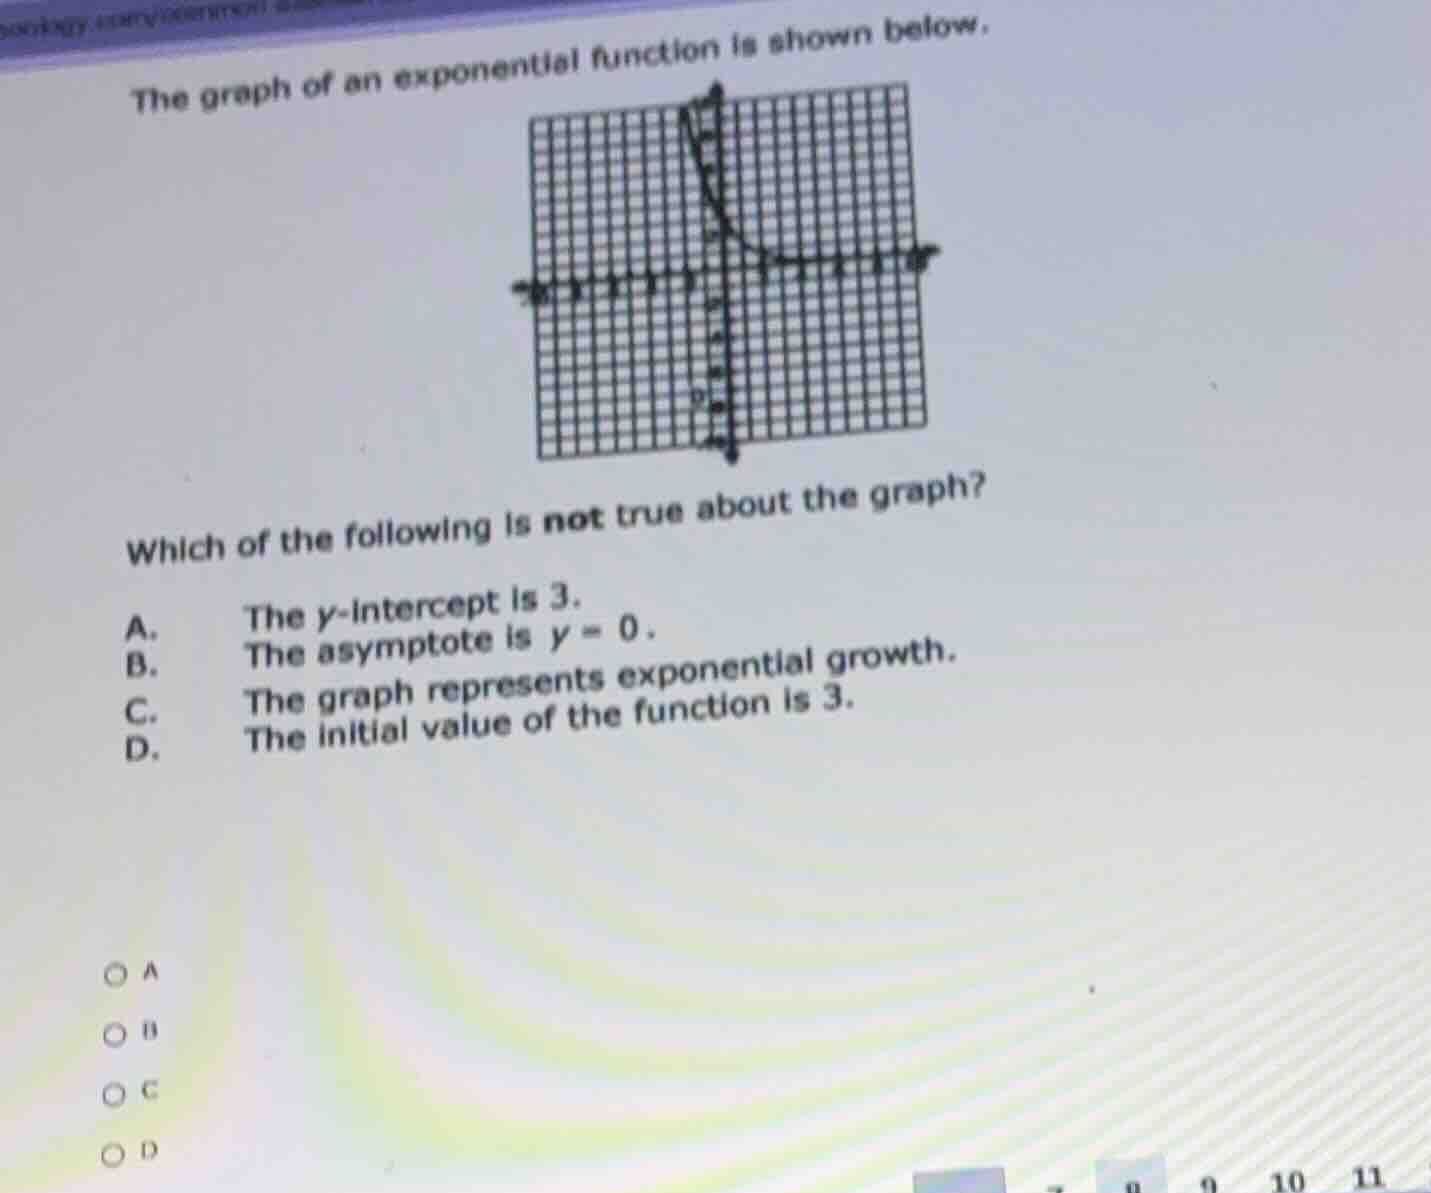
the graph of an exponential function is shown below.
which of the following is not true about the graph?
a. the \\(y\\)-intercept is 3.
b. the asymptote is \\(y = 0\\).
c. the graph represents exponential growth.
d. the initial value of the function is 3.
Identify the y-intercept
The y-intercept is where the curve crosses the vertical y-axis. Looking closely at the grid, the curve crosses the y-axis at \( (0, 3) \). Thus, the y-intercept is indeed 3.
Determine the asymptote
As the graph goes to the right, the curve flattens out and approaches the horizontal line \( y = 0 \) (the x-axis) without crossing it. Therefore, the horizontal asymptote is \( y = 0 \).
Analyze the growth behavior
An exponential function that decreases from left to right represents exponential decay, not growth. Since this curve goes downwards as \( x \) increases, it represents exponential decay.
Determine the initial value
The initial value of an exponential function of the form \( f(x) = a \cdot b^x \) is the value of the function when \( x = 0 \), which is \( f(0) = a \). This corresponds to the y-intercept, which is 3.
Identify the false statement
Comparing our findings with the choices:
- Statement A is true.
- Statement B is true.
- Statement C is false because the graph represents decay, not growth.
- Statement D is true.

Snap & solve any problem in the app
Get step-by-step solutions on Sovi AI
Photo-based solutions with guided steps
Explore more problems and detailed explanations
- (A) The y-intercept is 3.
- (B) The asymptote is y = 0.
- (C) The graph represents exponential growth. (Correct answer)
- (D) The initial value of the function is 3.