QUESTION IMAGE
Question
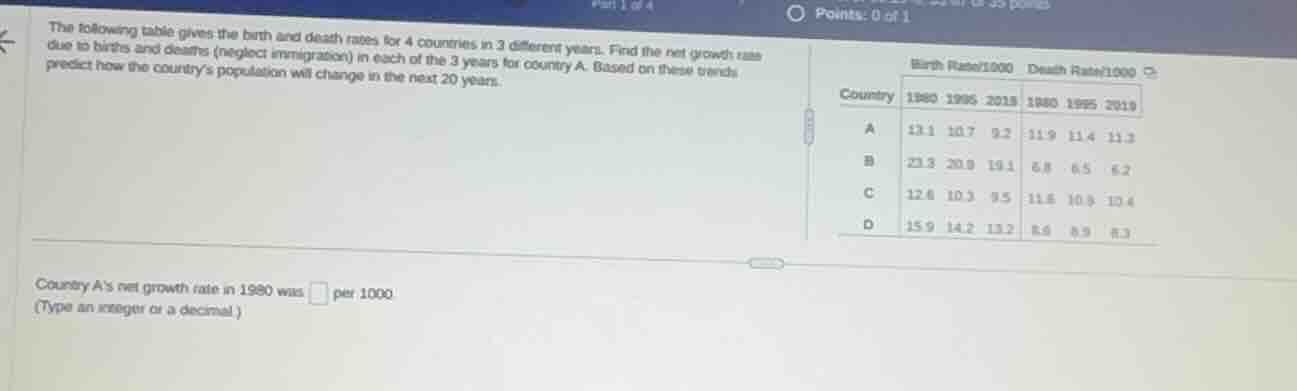
the following table gives the birth and death rates for 4 countries in 3 different years. find the net growth rate due to births and deaths (neglect immigration) in each of the 3 years for country a. based on these trends, predict how the countrys population will change in the next 20 years.
\
country as net growth rate in 1980 was per 1000.
(type an integer or a decimal.)
Identify the given values for Country A in 1980
From the table, locate the row for Country A and the columns corresponding to the year 1980:
- Birth Rate per 1000 in 1980: \(13.1\)
- Death Rate per 1000 in 1980: \(11.9\)
Calculate the net growth rate
The net growth rate per 1000 is calculated by subtracting the death rate from the birth rate:

Snap & solve any problem in the app
Get step-by-step solutions on Sovi AI
Photo-based solutions with guided steps
Explore more problems and detailed explanations
Country A's net growth rate in 1980 was <blank>1.2</blank> per 1000.