QUESTION IMAGE
Question
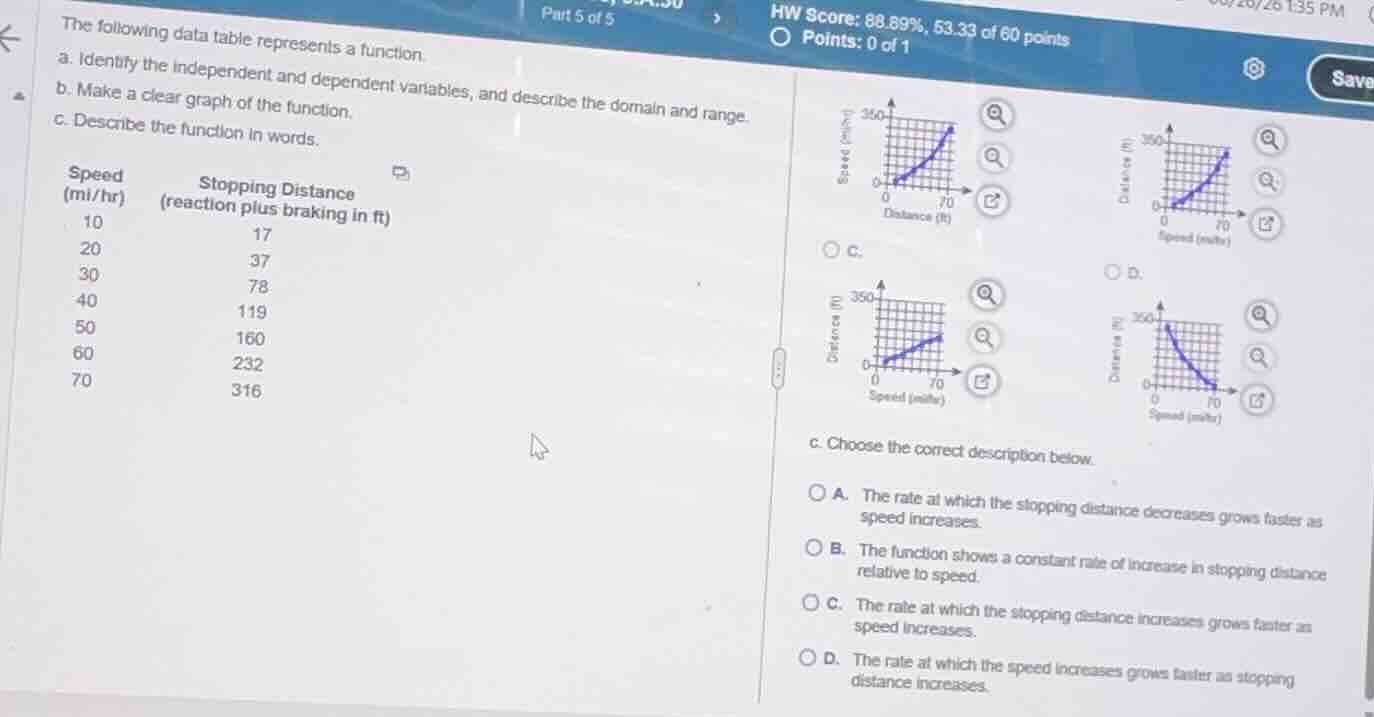
the following data table represents a function.
a. identify the independent and dependent variables, and describe the domain and range.
b. make a clear graph of the function.
c. describe the function in words.
\\(\
\\)
c. choose the correct description below.
a. the rate at which the stopping distance decreases grows faster as speed increases.
b. the function shows a constant rate of increase in stopping distance relative to speed.
c. the rate at which the stopping distance increases grows faster as speed increases.
d. the rate at which the speed increases grows faster as stopping distance increases.
Identify variables and graph axes
Using the Independent and Dependent Variables knowledge point
- Speed is the independent variable \(x\) (measured in mi/hr).
- Stopping Distance is the dependent variable \(y\) (measured in ft).
- Therefore, the horizontal axis must represent Speed (mi/hr) and the vertical axis must represent Distance (ft). This rules out graph A (which has Distance on the horizontal axis).
Analyze data trend for graphing
Using the Graph Interpretation knowledge point
- Let's look at the data points \((x, y)\): \((10, 17)\), \((20, 37)\), \((30, 78)\), \((40, 119)\), \((50, 160)\), \((60, 232)\), \((70, 316)\).
- At \(x = 70\), the stopping distance \(y\) is \(316\), which is close to the top of the vertical axis (\(350\)).
- Graph B shows a curve starting near \(0\) and rising steeply to just over \(300\) at \(x = 70\).
- Graph C shows a much flatter curve where the value at \(70\) is well below \(200\).
- Graph D shows a decreasing curve.
- Thus, Graph B is the correct representation.
Analyze rate of change
Using the Rate of Change Interpretation knowledge point
- Let's calculate the successive differences in stopping distance for each \(10\text{ mi/hr}\) increase in speed:
- From \(10\) to \(20\): \(37 - 17 = 20\text{ ft}\)
- From \(20\) to \(30\): \(78 - 37 = 41\text{ ft}\)
- From \(30\) to \(40\): \(119 - 78 = 41\text{ ft}\)
- From \(40\) to \(50\): \(160 - 119 = 41\text{ ft}\)
- From \(50\) to \(60\): \(232 - 160 = 72\text{ ft}\)
- From \(60\) to \(70\): \(316 - 232 = 84\text{ ft}\)
- The differences are generally increasing, meaning the stopping distance grows faster as speed increases.
- This matches option C: "The rate at which the stopping distance increases grows faster as speed increases."

Snap & solve any problem in the app
Get step-by-step solutions on Sovi AI
Photo-based solutions with guided steps
Explore more problems and detailed explanations
Question 1
- (A) Graph with Distance on the horizontal axis and Speed on the vertical axis
- (B) Graph with Speed on the horizontal axis and Distance on the vertical axis, rising steeply to over 300 at speed 70 (Correct answer)
- (C) Graph with Speed on the horizontal axis and Distance on the vertical axis, rising gently to under 200 at speed 70
- (D) Graph with Speed on the horizontal axis and Distance on the vertical axis, showing a decreasing curve
Question 2
- (A) The rate at which the stopping distance decreases grows faster as speed increases.
- (B) The function shows a constant rate of increase in stopping distance relative to speed.
- (C) The rate at which the stopping distance increases grows faster as speed increases. (Correct answer)
- (D) The rate at which the speed increases grows faster as stopping distance increases.