QUESTION IMAGE
Question
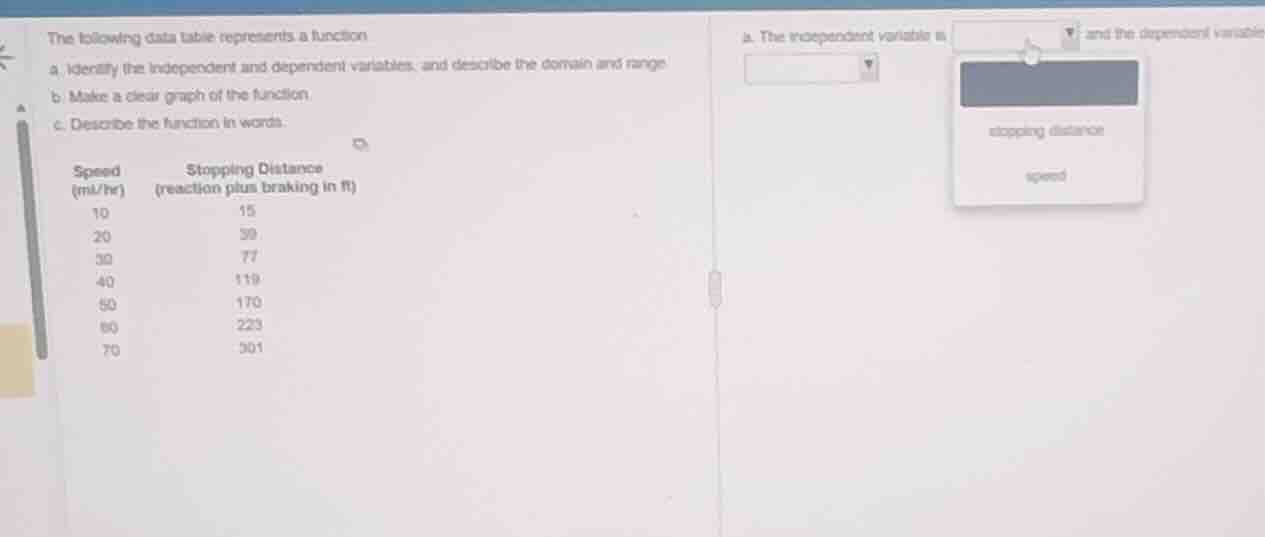
the following data table represents a function.
a. identify the independent and dependent variables, and describe the domain and range.
b. make a clear graph of the function.
c. describe the function in words.
\
a. the independent variable is dropdown and the dependent variable is dropdown.
Identify the independent and dependent variables
In a physical relationship, the independent variable is the quantity that is controlled or chosen, while the dependent variable is the quantity that changes in response. Here, the stopping distance of a vehicle depends on how fast it is traveling. Therefore, the speed is the independent variable, and the stopping distance is the dependent variable.
Determine the domain of the function
The domain is the set of all possible input values (independent variable). Looking at the "Speed (mi/hr)" column in the data table, the input values are:
Determine the range of the function
The range is the set of all possible output values (dependent variable). Looking at the "Stopping Distance (ft)" column in the data table, the output values corresponding to the domain are:
Describe the function in words
As the speed of the vehicle increases, the stopping distance also increases. The rate of increase in stopping distance is not constant; it grows more rapidly at higher speeds, which is typical of quadratic physical relationships where braking distance is proportional to the square of the speed.

Snap & solve any problem in the app
Get step-by-step solutions on Sovi AI
Photo-based solutions with guided steps
Explore more problems and detailed explanations
The independent variable is <blank>speed</blank> and the dependent variable is <blank>stopping distance</blank>.