QUESTION IMAGE
Question
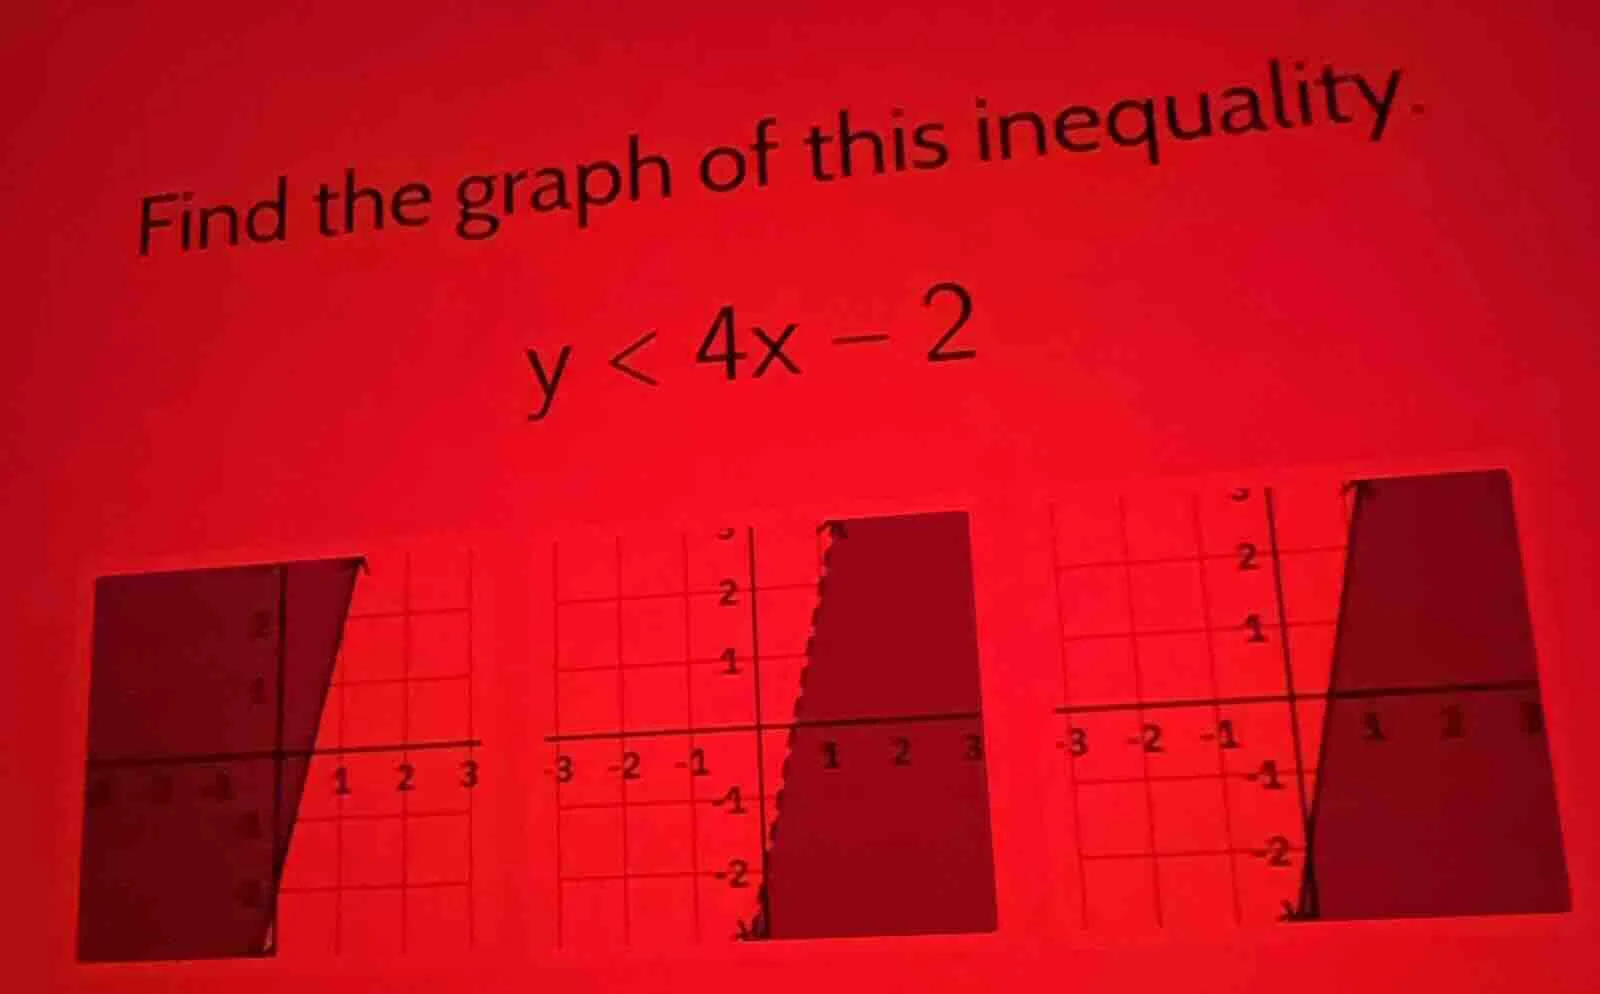
find the graph of this inequality.
y < 4x - 2
Step1: Analyze the inequality type
The inequality is \( y < 4x - 2 \), which is a linear inequality. First, we consider the boundary line \( y = 4x - 2 \). Since the inequality is \( < \) (not \( \leq \)), the boundary line should be dashed (to indicate that the points on the line are not included in the solution set).
Step2: Determine the slope and y-intercept
For the line \( y = 4x - 2 \), the slope \( m = 4 \) (which means for every 1 unit we move to the right along the x - axis, we move up 4 units) and the y - intercept \( b=-2 \) (the line crosses the y - axis at \( (0, - 2) \)).
Step3: Test a point to find the region
We can test the point \( (0,0) \) in the inequality \( y < 4x - 2 \). Substitute \( x = 0 \) and \( y = 0 \) into the inequality: \( 0<4(0)-2\), which simplifies to \( 0 < - 2 \). This is false. So the region that satisfies the inequality is not the one containing \( (0,0) \). Instead, we look for the region below the line \( y = 4x - 2 \) (because the inequality is \( y < 4x - 2 \)).
Step4: Match with the graphs
We need to find the graph with a dashed line (since \( y<4x - 2 \), not \( \leq \)) representing \( y = 4x - 2 \) and the shaded region below the line. We analyze the slope and y - intercept: the line has a positive slope (4) and y - intercept at - 2. So we look for the graph where the line is dashed, has a slope of 4 (steep positive slope) and y - intercept at - 2, and the shading is below the line.

Snap & solve any problem in the app
Get step-by-step solutions on Sovi AI
Photo-based solutions with guided steps
Explore more problems and detailed explanations
The graph of \( y < 4x - 2 \) should have a dashed line \( y = 4x - 2 \) (since the inequality is strict, \( < \)) with a slope of 4 and y - intercept at \( (0, - 2) \), and the region below the line is shaded. To identify the correct graph, we check for the dashed line, the correct slope and y - intercept, and the shading below the line. (Note: Since the specific graph options are not clearly labeled with identifiers in the text, but based on the analysis, the graph with a dashed line \( y = 4x - 2 \) and shading below the line is the correct one.)