QUESTION IMAGE
Question
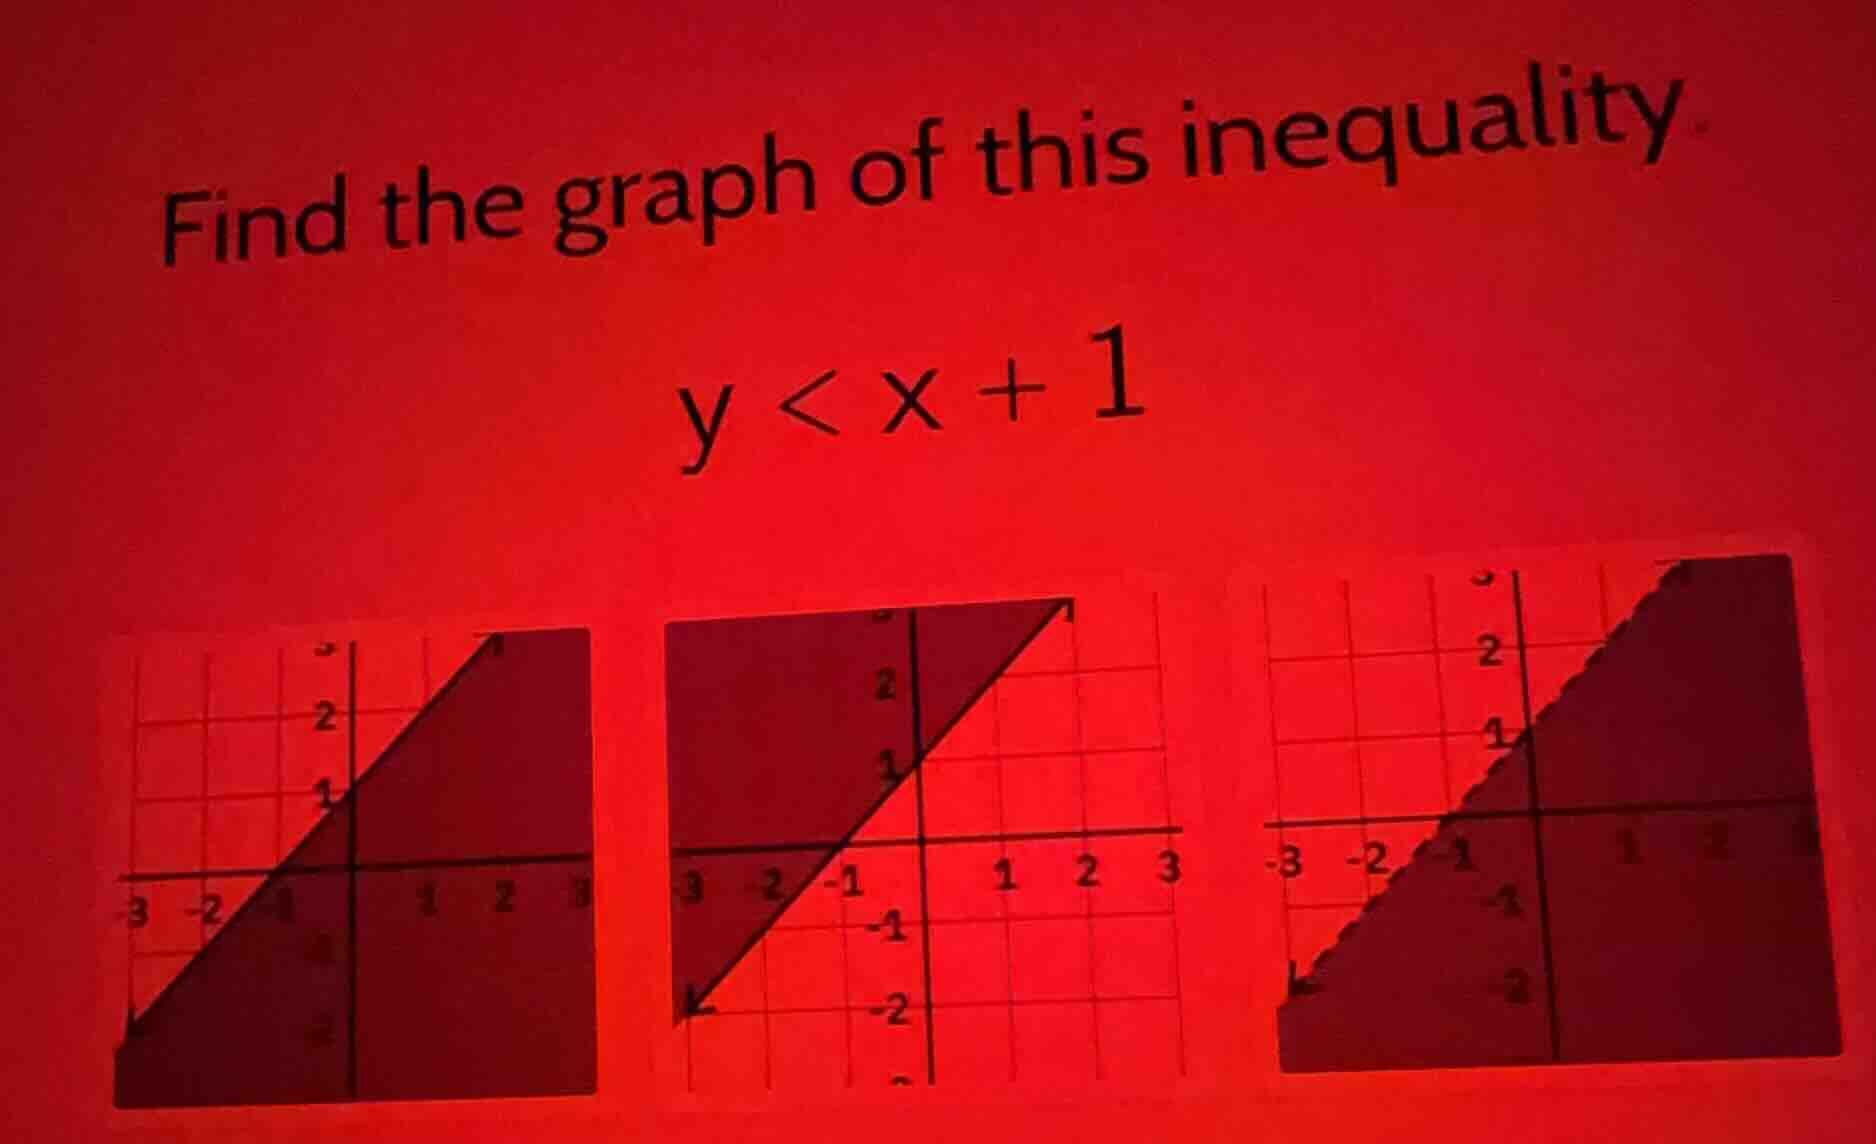
find the graph of this inequality.
y < x + 1
Step1: Analyze the inequality \( y < x + 1 \)
First, consider the boundary line \( y = x + 1 \). The slope of this line is \( 1 \) and the y - intercept is \( 1 \). Since the inequality is \( y < x + 1 \) (not \( \leq \)), the boundary line should be a dashed line (to indicate that the points on the line are not included in the solution set).
Step2: Determine the region to shade
To find which side of the line to shade, we can use a test point. A common test point is \( (0,0) \). Substitute \( x = 0 \) and \( y = 0 \) into the inequality: \( 0<0 + 1\), which simplifies to \( 0 < 1 \). This is a true statement. So, we shade the region that contains the point \( (0,0) \).
Now, let's analyze the three graphs:
- For the first graph: Check the boundary line (should be dashed for \( < \)), and the shaded region. If the boundary line is dashed and the region containing \( (0,0) \) is shaded, it could be a candidate. But we need to check the slope and intercept. The line \( y=x + 1\) has a slope of 1 and y - intercept 1.
- For the second graph: If the boundary line is solid, it's incorrect because our inequality is \( < \), not \( \leq \). So we can eliminate the second graph.
- For the third graph: The line seems to have a different slope or intercept. The line \( y=x + 1\) passes through \( (0,1) \) and has a slope of 1. The first graph (assuming the boundary line is dashed and the shading is correct) should be the graph of \( y < x + 1 \).

Snap & solve any problem in the app
Get step-by-step solutions on Sovi AI
Photo-based solutions with guided steps
Explore more problems and detailed explanations
The graph (the first one among the three given graphs) that has a dashed line \( y=x + 1 \) (or a line with slope 1 and y - intercept 1) and shades the region containing the point \( (0,0) \) (below the line) is the graph of the inequality \( y < x + 1 \). (Since the actual graphs are not fully described in text, but based on the analysis, the correct graph should have a dashed line \( y = x+1 \) and shade the area below the line, including the region with the test point \( (0,0) \))