QUESTION IMAGE
Question
examine the table.
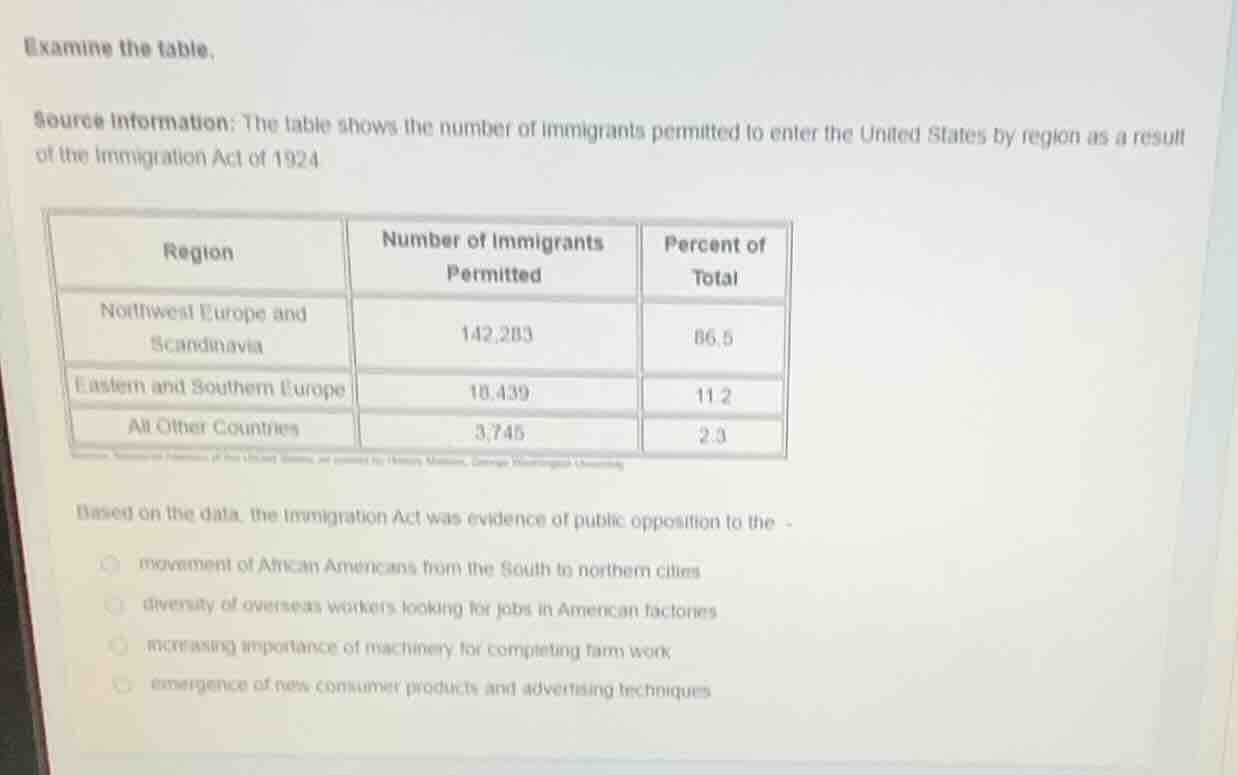
source information: the table shows the number of immigrants permitted to enter the united states by region as a result of the immigration act of 1924
| region | number of immigrants permitted | percent of total |
|---|---|---|
| eastern and southern europe | 18,439 | 11.2 |
| all other countries | 3,745 | 2.3 |
based on the data, the immigration act was evidence of public opposition to the -
- movement of african americans from the south to northern cities
- diversity of overseas workers looking for jobs in american factories
- increasing importance of machinery for competing farm work
- emergence of new consumer products and advertising techniques
The 1924 Immigration Act's quotas, shown in the table, heavily favor immigrants from Northwest Europe and Scandinavia (86.5% of permitted immigrants) while severely limiting those from Eastern/Southern Europe and other regions. This reflects nativist sentiment and opposition to the growing diversity of immigrant workers from non-Western European backgrounds who were seeking factory jobs in the U.S. The other options are unrelated: the Great Migration of African Americans, farm machinery, and consumer products have no connection to this immigration policy data.

Snap & solve any problem in the app
Get step-by-step solutions on Sovi AI
Photo-based solutions with guided steps
Explore more problems and detailed explanations
diversity of overseas workers looking for jobs in American factories