QUESTION IMAGE
Question
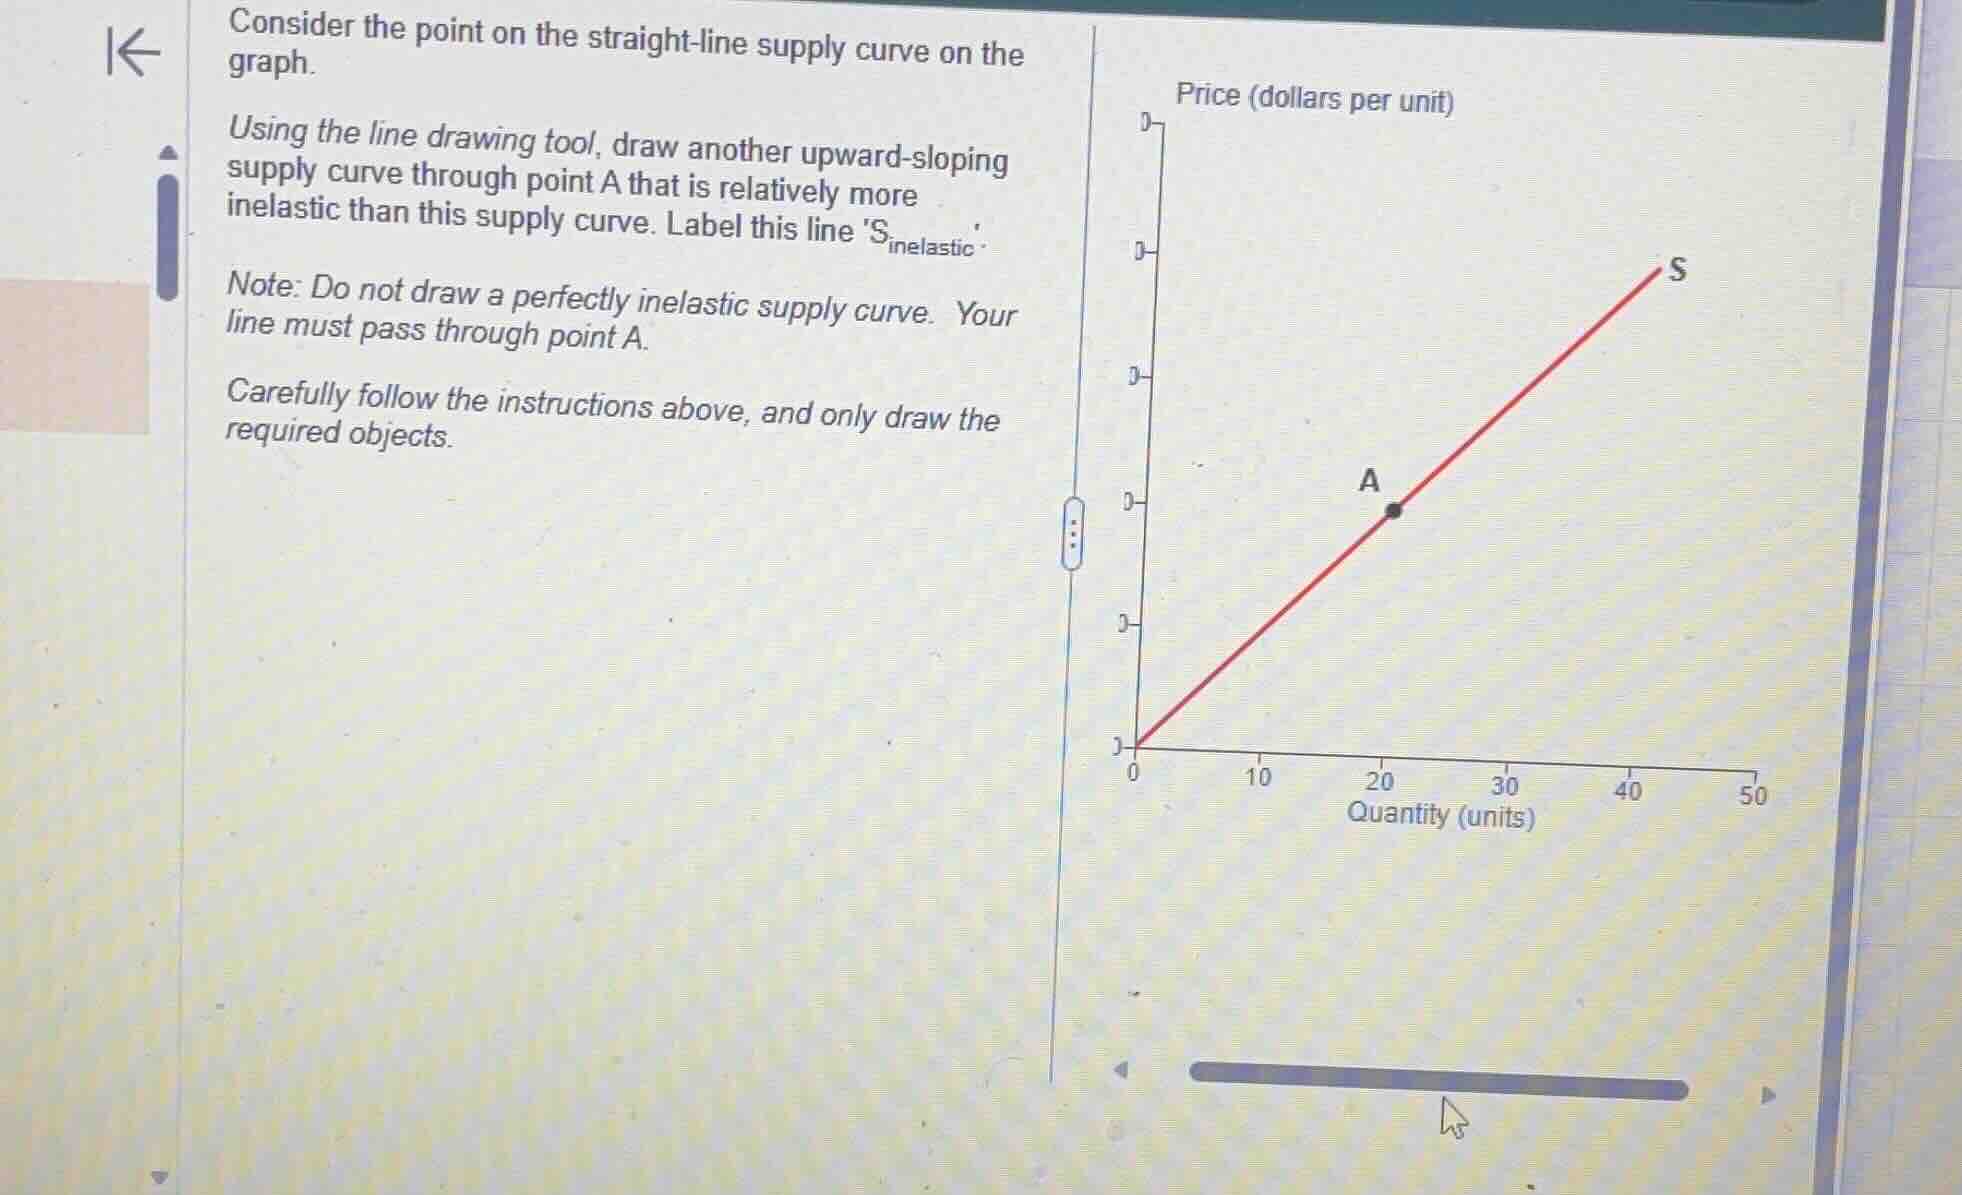
consider the point on the straight-line supply curve on the graph. using the line drawing tool, draw another upward - sloping supply curve through point a that is relatively more inelastic than this supply curve. label this line s_inelastic. note: do not draw a perfectly inelastic supply curve. your line must pass through point a. carefully follow the instructions above, and only draw the required objects.
Brief Explanations
To draw a relatively more inelastic supply curve through point A:
- Recall that a more inelastic supply curve is steeper (has a greater slope) than the original supply curve (since inelasticity means quantity supplied is less responsive to price changes, so a steeper curve shows that a given price change leads to a smaller quantity change).
- The original supply curve \( S \) passes through the origin \((0,0)\) and point A (let's assume point A has coordinates, say, \((20, P_A)\) from the graph). A more inelastic curve \( S_{\text{inelastic}} \) through point A should have a steeper slope. So, we can start from a point on the price axis (above the origin, to make it steeper) and pass through point A. For example, if we take a point like \((0, P_0)\) where \( P_0>0 \) and draw a line from \((0, P_0)\) through point A, this line will be steeper (more inelastic) than the original supply curve which goes through \((0,0)\).
- Use the line - drawing tool to draw this steeper line through point A and label it \( S_{\text{inelastic}} \). Make sure it is upward - sloping, passes through A, and is not perfectly inelastic (so it can't be a vertical line).

Snap & solve any problem in the app
Get step-by-step solutions on Sovi AI
Photo-based solutions with guided steps
Explore more problems and detailed explanations
To draw \( S_{\text{inelastic}} \):
- Identify point A on the original supply curve \( S \).
- Determine that a more inelastic supply curve is steeper. So, draw a line that passes through point A and has a steeper slope than the original supply curve \( S \). This line should start from a point on the price axis (not the origin, to make it steeper) and go through point A, maintaining an upward - sloping direction. Label this line \( S_{\text{inelastic}} \). (Note: Since this is a graph - drawing task, the key is the concept of slope and inelasticity. The actual drawing is done using the line - drawing tool in the graphing interface, with the curve being steeper and passing through A.)