QUESTION IMAGE
Question
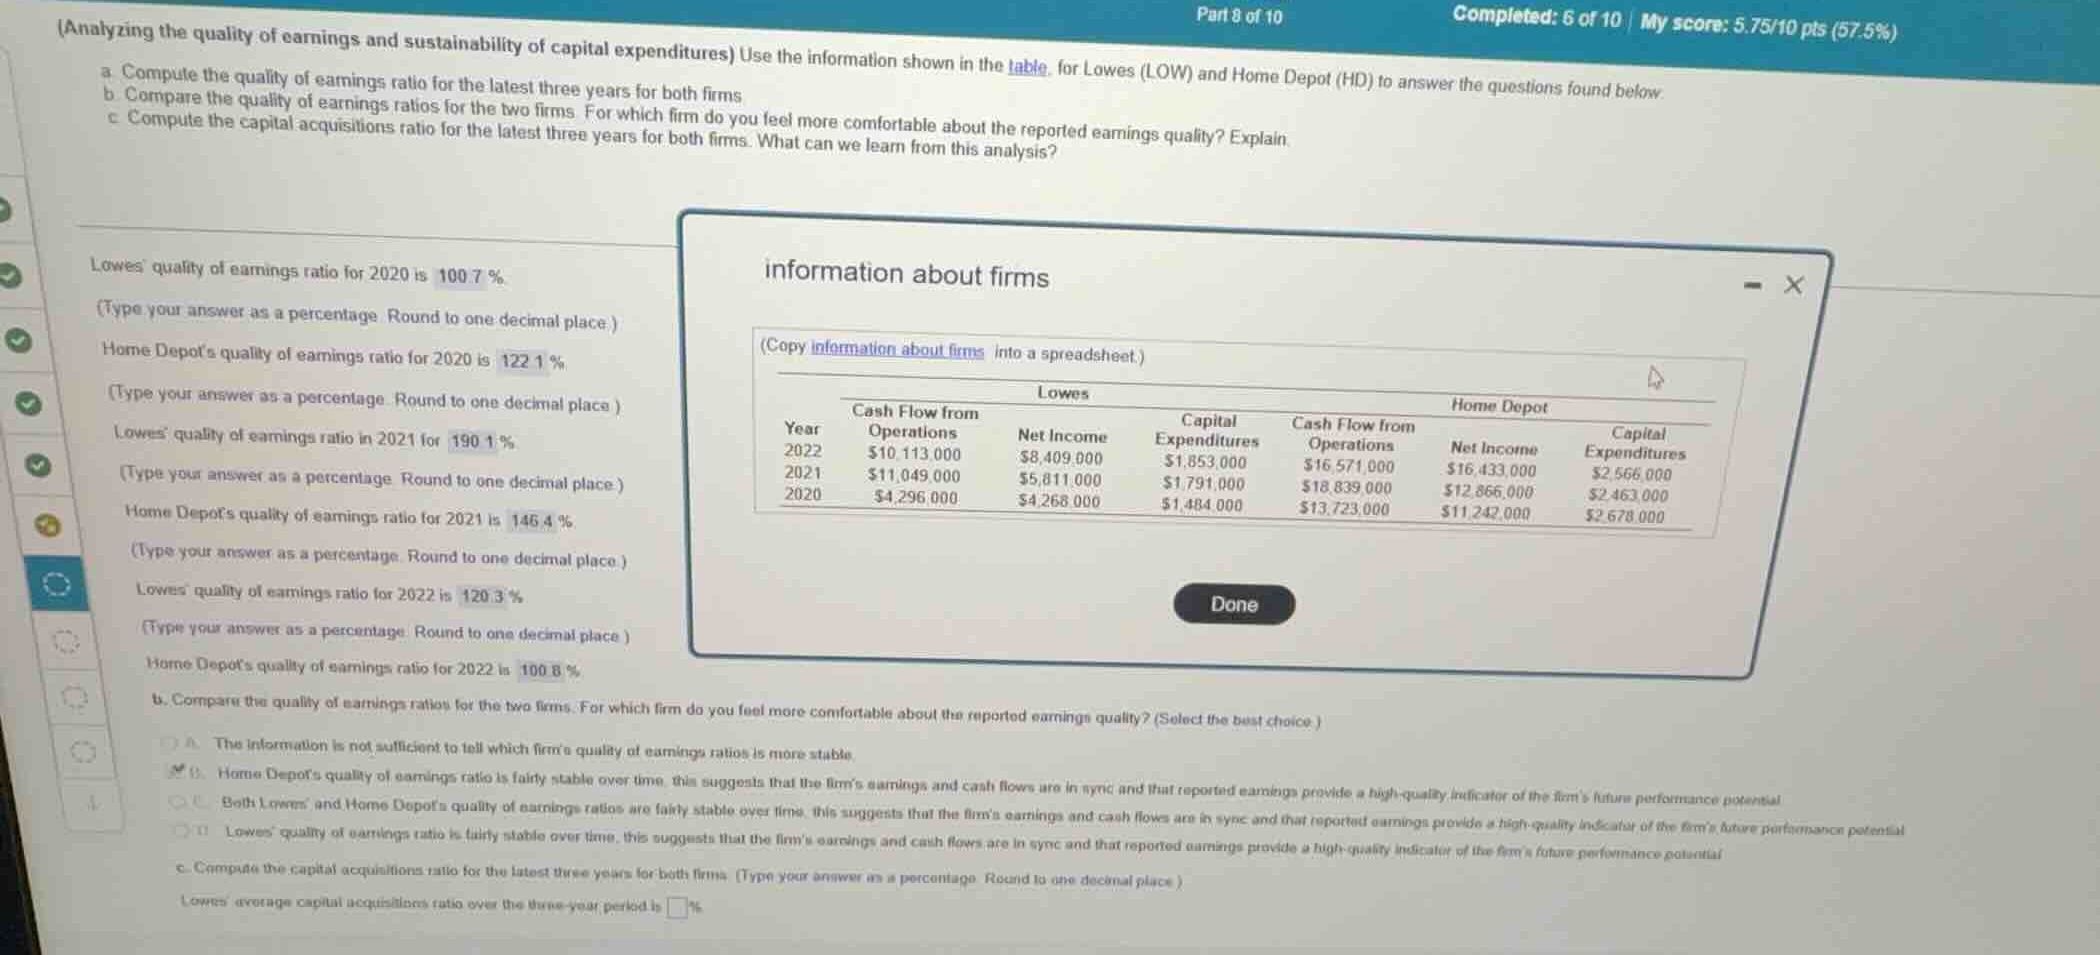
(analyzing the quality of earnings and sustainability of capital expenditures) use the information shown in the table, for lowes (low) and home depot (hd) to answer the questions found below.
a. compute the quality of earnings ratio for the latest three years for both firms.
b. compare the quality of earnings ratios for the two firms. for which firm do you feel more comfortable about the reported earnings quality? explain.
c. compute the capital acquisitions ratio for the latest three years for both firms. what can we learn from this analysis?
lowes quality of earnings ratio for 2020 is 100.7%.
(type your answer as a percentage. round to one decimal place.)
home depots quality of earnings ratio for 2020 is 122.1%.
(type your answer as a percentage. round to one decimal place.)
lowes quality of earnings ratio in 2021 is 190.1%.
(type your answer as a percentage. round to one decimal place.)
home depots quality of earnings ratio for 2021 is 146.4%.
(type your answer as a percentage. round to one decimal place.)
lowes quality of earnings ratio for 2022 is 120.3%.
(type your answer as a percentage. round to one decimal place.)
home depots quality of earnings ratio for 2022 is 100.8%.
b. compare the quality of earnings ratios for the two firms. for which firm do you feel more comfortable about the reported earnings quality? (select the best choice.)
a. the information is not sufficient to tell which firms quality of earnings ratios is more stable.
b. home depots quality of earnings ratio is fairly stable over time, this suggests that the firms earnings and cash flows are in sync and that reported earnings provide a high-quality indicator of the firms future performance potential.
c. both lowes and home depots quality of earnings ratios are fairly stable over time, this suggests that the firms earnings and cash flows are in sync and that reported earnings provide a high-quality indicator of the firms future performance potential.
d. lowes quality of earnings ratio is fairly stable over time, this suggests that the firms earnings and cash flows are in sync and that reported earnings provide a high-quality indicator of the firms future performance potential.
c. compute the capital acquisitions ratio for the latest three years for both firms. (type your answer as a percentage. round to one decimal place.)
lowes average capital acquisitions ratio over the three-year period is %
Identify formulas and data
The problem asks for calculations based on the provided financial data for Lowes and Home Depot.
The relevant formulas are:
- Quality of Earnings Ratio:
- Capital Acquisitions Ratio:
Let's extract the data from the table:
- Lowes:
- 2022: Cash Flow from Operations = \$10,113,000; Net Income = \$8,409,000; Capital Expenditures = \$1,853,000
- 2021: Cash Flow from Operations = \$11,049,000; Net Income = \$5,811,000; Capital Expenditures = \$1,791,000
- 2020: Cash Flow from Operations = \$4,296,000; Net Income = \$4,268,000; Capital Expenditures = \$1,484,000
- Home Depot:
- 2022: Cash Flow from Operations = \$16,571,000; Net Income = \$16,433,000; Capital Expenditures = \$2,566,000
- 2021: Cash Flow from Operations = \$18,839,000; Net Income = \$12,866,000; Capital Expenditures = \$2,463,000
- 2020: Cash Flow from Operations = \$13,723,000; Net Income = \$11,242,000; Capital Expenditures = \$2,678,000
Analyze part (b) multiple choice
Let's look at the quality of earnings ratios calculated in the image:
- Lowes:
- 2020: \(100.7\%\)
- 2021: \(190.1\%\)
- 2022: \(120.3\%\)
- Home Depot:
- 2020: \(122.1\%\)
- 2021: \(146.4\%\)
- 2022: \(100.8\%\)
Comparing the stability of the ratios:
- Lowes' ratio fluctuates significantly from \(100.7\%\) to \(190.1\%\) and then to \(120.3\%\).
- Home Depot's ratio is relatively more stable, ranging from \(100.8\%\) to \(146.4\%\).
Let's evaluate the options for part (b):
- Option A: The information is not sufficient...
- Option B: Home Depot's quality of earnings ratio is fairly stable over time, this suggests that the firm's earnings and cash flows are in sync and that reported earnings provide a high-quality indicator of the firm's future performance potential.
- Option C: Both Lowes' and Home Depot's...
- Option D: Lowes' quality of earnings ratio is fairly stable over time...
Since Home Depot's ratio is more stable and consistently closer to or above \(100\%\) without extreme spikes compared to Lowes' massive jump to \(190.1\%\) in 2021, Option B is the best choice.
Calculate Lowes' average capital acquisitions ratio
The question asks for "Lowes' average capital acquisitions ratio over the three-year period".
First, let's calculate the capital acquisitions ratio for Lowes for each of the three years:
- 2022:
- 2021:
- 2020:
Now, let's compute the average of these three annual ratios:
\[
\text{Average Ratio} = \frac{545.76\% + 616.92\% + 289.49\%}{3} = \frac{1452.17\%}{3} \approx 484.1\%
\…

Snap & solve any problem in the app
Get step-by-step solutions on Sovi AI
Photo-based solutions with guided steps
Explore more problems and detailed explanations
Part b
The correct option is B:
Home Depot's quality of earnings ratio is fairly stable over time, this suggests that the firm's earnings and cash flows are in sync and that reported earnings provide a high-quality indicator of the firm's future performance potential.
Part c
Lowes' average capital acquisitions ratio over the three-year period is \(484.1\%\) (calculated as the average of the three annual ratios: \(545.8\%\) for 2022, \(616.9\%\) for 2021, and \(289.5\%\) for 2020).
(Note: If your online platform calculates this using the three-year aggregate totals, the ratio is \(496.5\%\)).