QUESTION IMAGE
Question
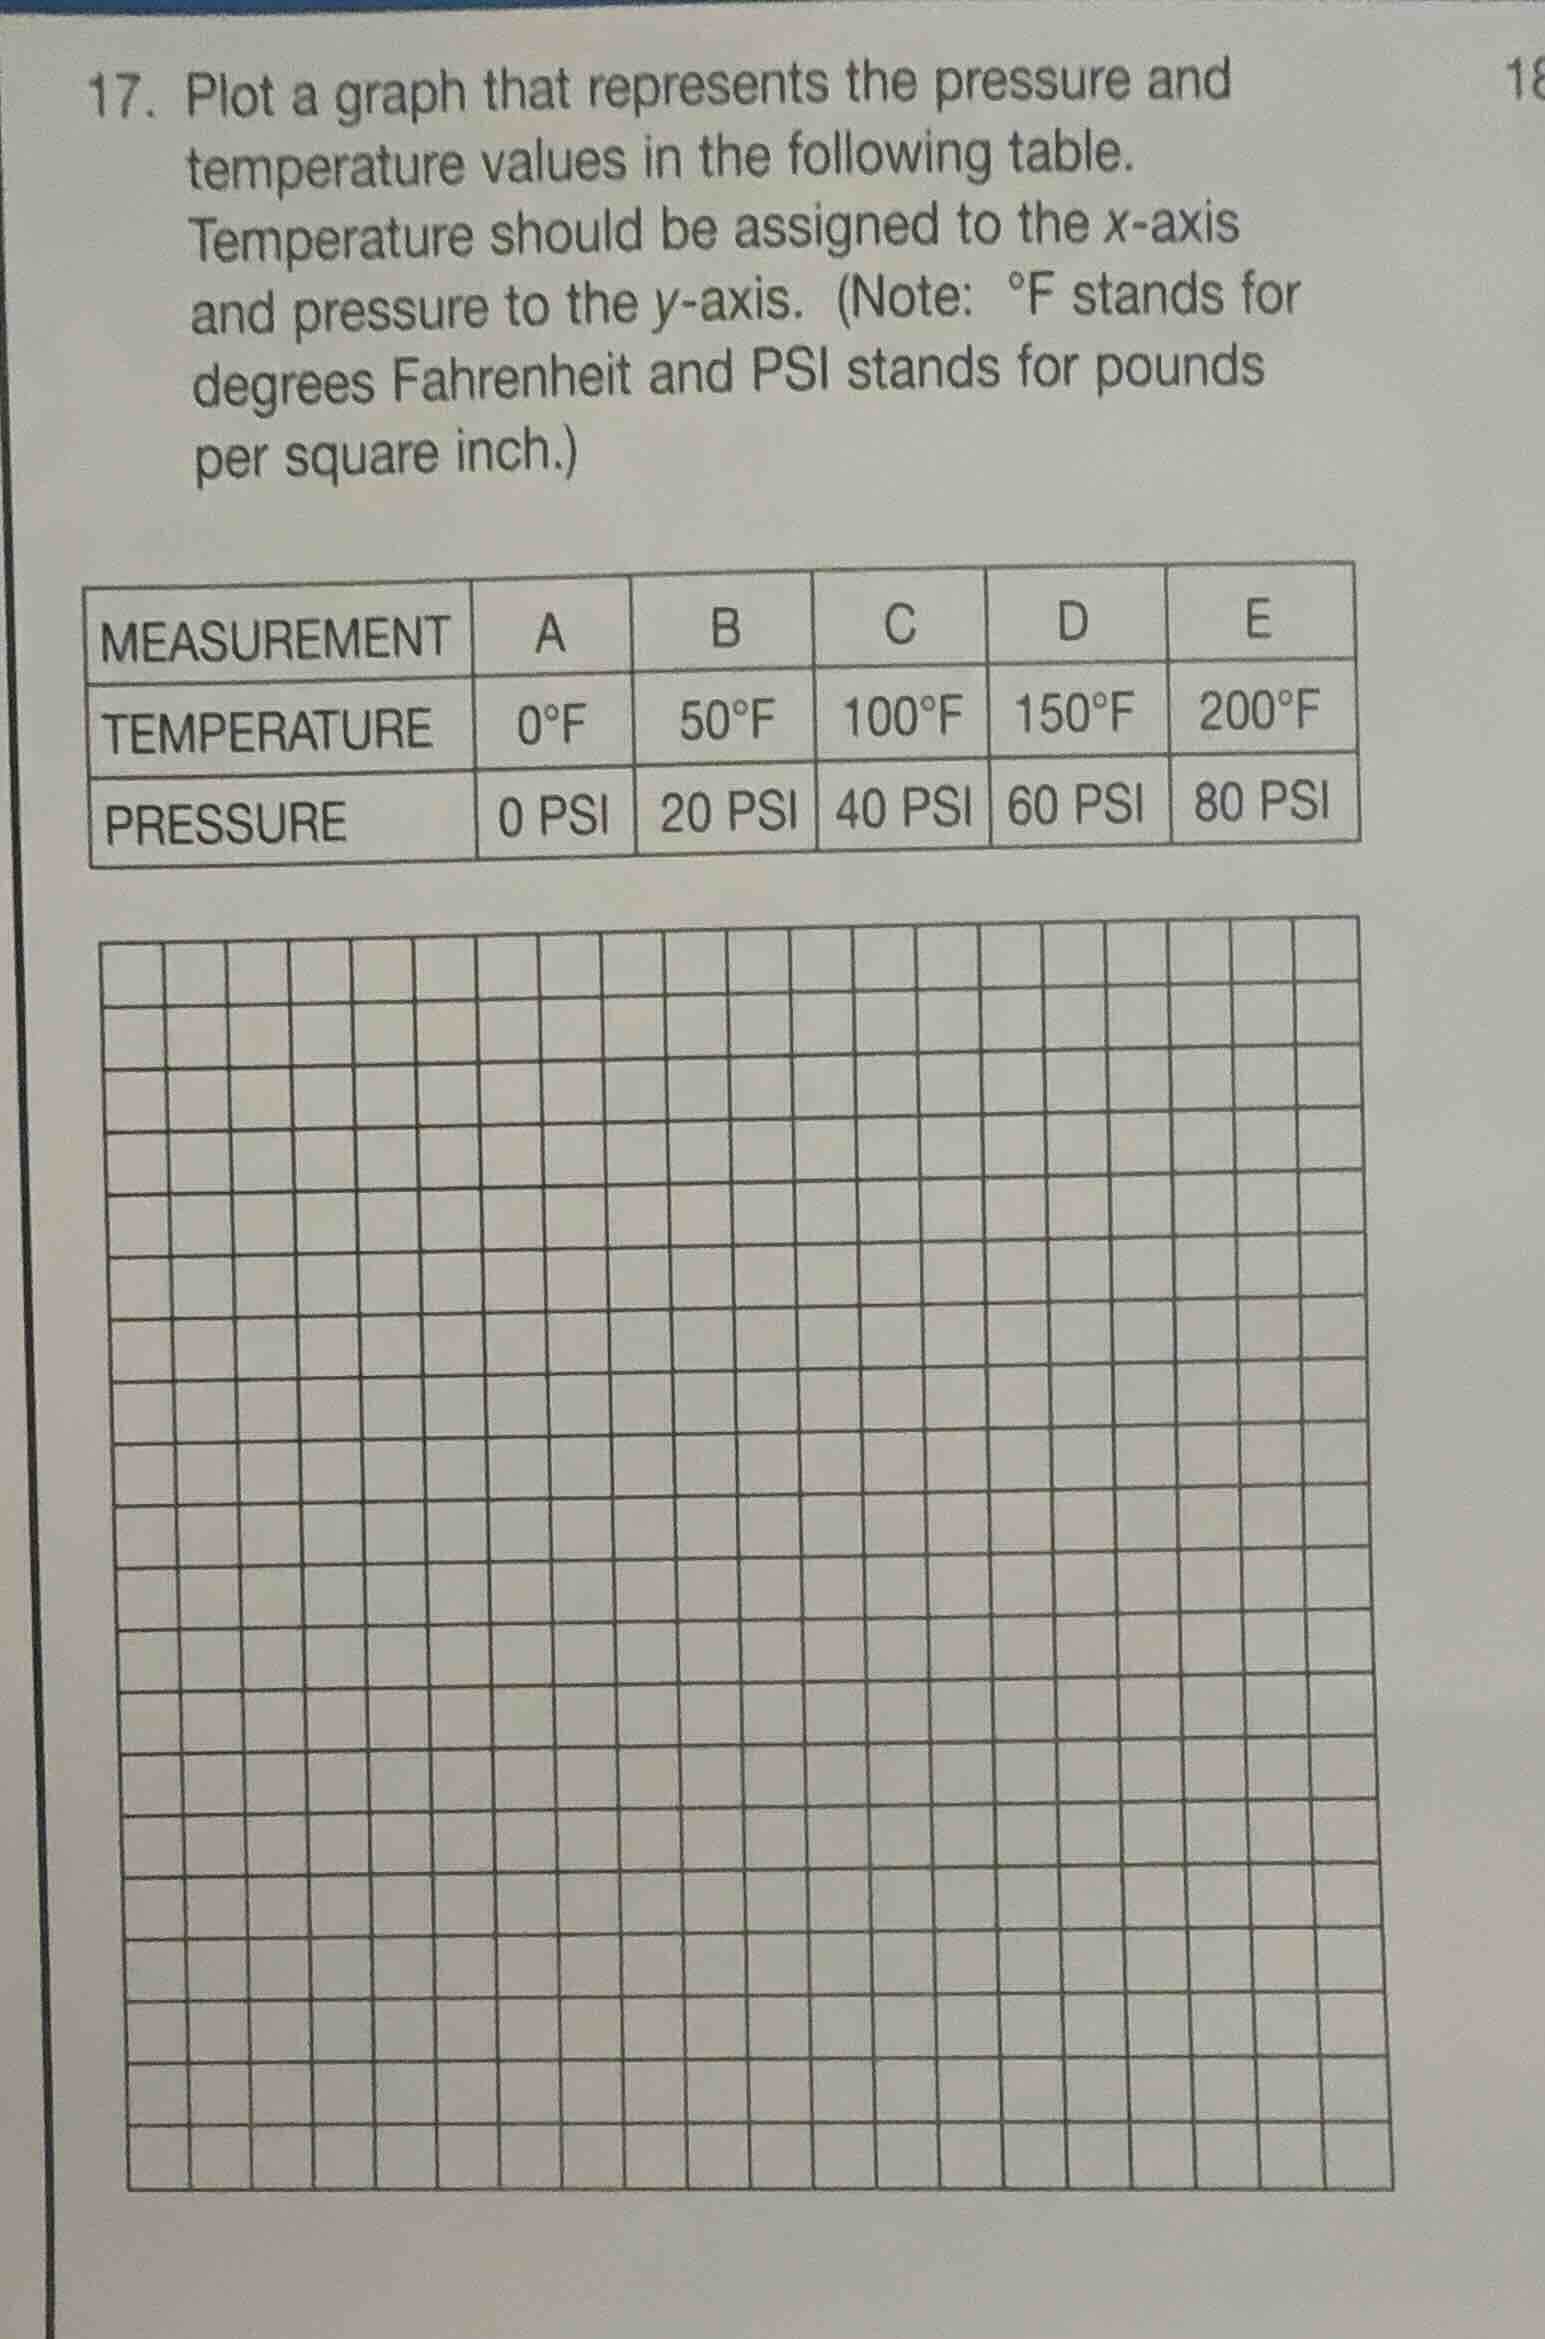
- plot a graph that represents the pressure and temperature values in the following table. temperature should be assigned to the x-axis and pressure to the y-axis. (note: °f stands for degrees fahrenheit and psi stands for pounds per square inch.)
\
$$\begin{tabular}{|l|c|c|c|c|c|}
\\hline
measurement & a & b & c & d & e \\\\
\\hline
temperature & 0°f & 50°f & 100°f & 150°f & 200°f \\\\
\\hline
pressure & 0 psi & 20 psi & 40 psi & 60 psi & 80 psi \\\\
\\hline
\\end{tabular}$$
Identify the variables and axes
The problem states that temperature should be assigned to the \(x\)-axis and pressure to the \(y\)-axis.
- \(x\)-axis: Temperature (\(^\circ\text{F}\))
- \(y\)-axis: Pressure (\(\text{PSI}\))
Determine the ordered pairs
Using the Ordered Pairs and Data Point Plotting knowledge points
$$
LATEXBLOCK0
$$
Determine the linear relationship
Using the Graphing Linear Equations knowledge point
$$
LATEXBLOCK1
$$

Snap & solve any problem in the app
Get step-by-step solutions on Sovi AI
Photo-based solutions with guided steps
Explore more problems and detailed explanations
To plot the graph representing the pressure and temperature values:
- Identify the Axes:
- \(x\)-axis: Temperature (\(^\circ\text{F}\)) with a scale from \(0\) to \(200^\circ\text{F}\).
- \(y\)-axis: Pressure (\(\text{PSI}\)) with a scale from \(0\) to \(80\text{ PSI}\).
- Plot the Data Points \((x, y)\):
- A: \((0, 0)\)
- B: \((50, 20)\)
- C: \((100, 40)\)
- D: \((150, 60)\)
- E: \((200, 80)\)
- Draw the Line:
- Connect the plotted points with a straight line starting at the origin \((0,0)\) and passing through \((200, 80)\), representing the linear relationship \(y = 0.4x\).