QUESTION IMAGE
Question
- match each graph with its description. *
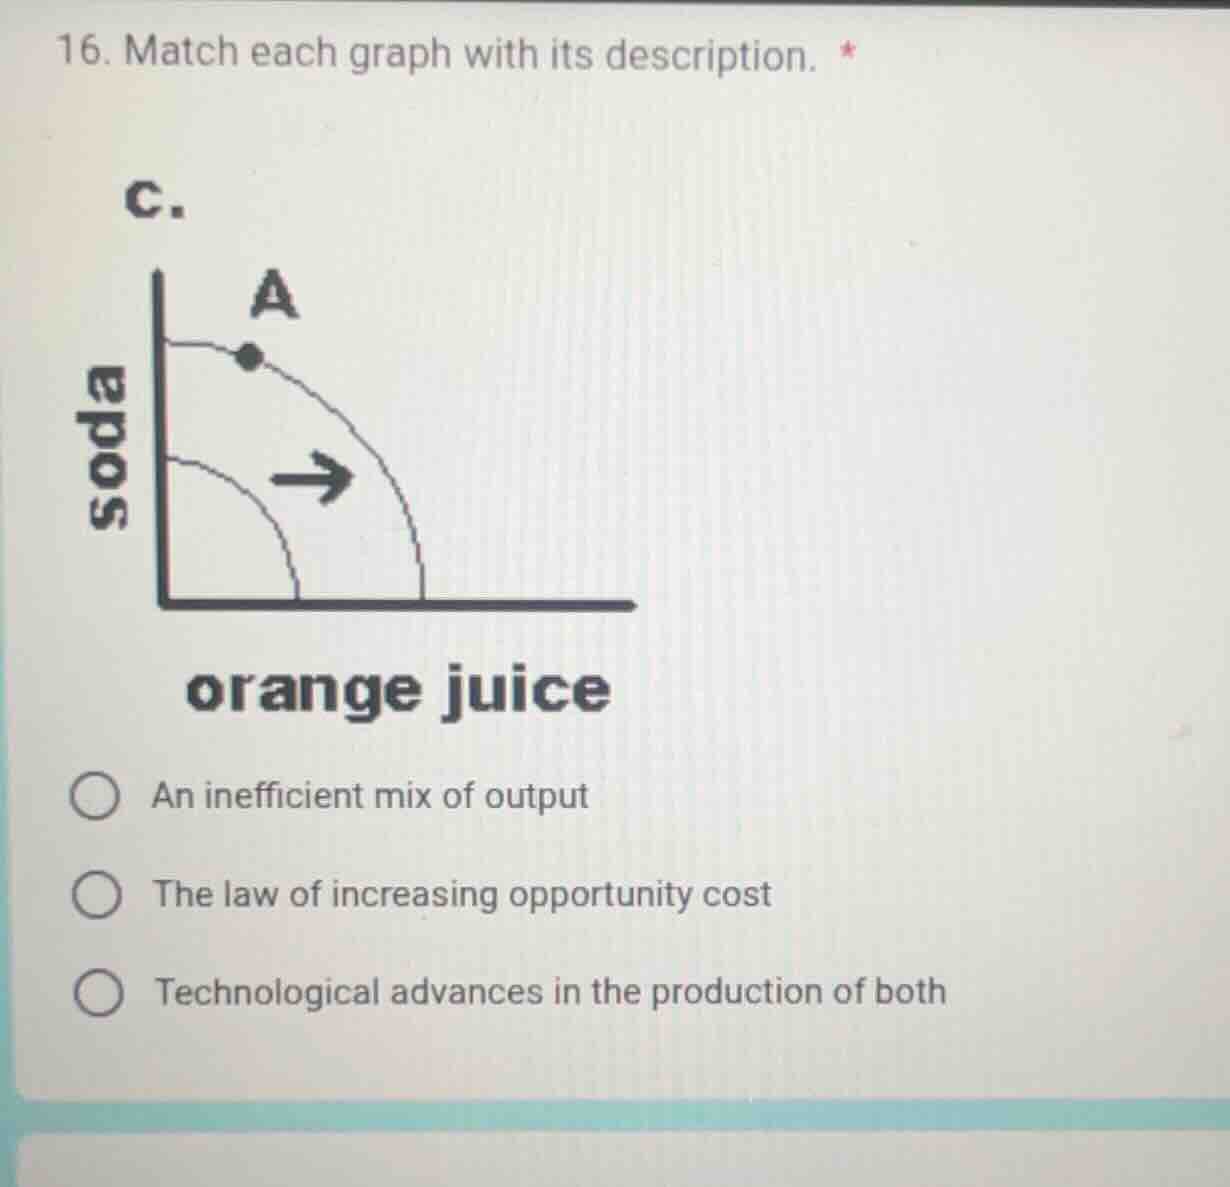
c.
soda
orange juice
- an inefficient mix of output
- the law of increasing opportunity cost
- technological advances in the production of both
Identify the graph type
The graph shows a Production Possibilities Curve (PPC) with "soda" on the vertical axis and "orange juice" on the horizontal axis.
Analyze the shift
The arrow indicates an outward shift of the entire curve away from the origin.
Connect to economic concepts
An outward shift of the Production Possibilities Curve represents an increase in productive capacity.
Evaluate the options
- "An inefficient mix of output" refers to a point inside the curve.
- "The law of increasing opportunity cost" is reflected by the bowed-out shape.
- "Technological advances in the production of both" causes the entire curve to shift outward.

Snap & solve any problem in the app
Get step-by-step solutions on Sovi AI
Photo-based solutions with guided steps
Explore more problems and detailed explanations
- An inefficient mix of output
- The law of increasing opportunity cost
- Technological advances in the production of both (Correct answer)