QUESTION IMAGE
Question
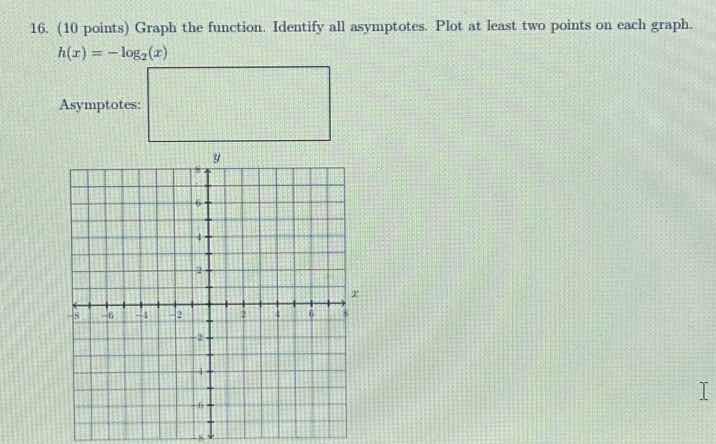
- (10 points) graph the function. identify all asymptotes. plot at least two points on each graph.
(h(x) = -\log_2(x))
asymptotes:
Step1: Identify the vertical asymptote
$$x = 0$$
Step2: Calculate the first point
$$h(1) = -\log_{2}(1) = 0 \implies (1, 0)$$
Step3: Calculate the second point
$$h(2) = -\log_{2}(2) = -1 \implies (2, -1)$$
Step4: Calculate a third point
$$h(4) = -\log_{2}(4) = -2 \implies (4, -2)$$

Snap & solve any problem in the app
Get step-by-step solutions on Sovi AI
Photo-based solutions with guided steps
Explore more problems and detailed explanations
Asymptote: Vertical asymptote at \(x = 0\)
Points to plot: \((1, 0)\), \((2, -1)\), and \((4, -2)\)
Graph description: A curve in the first and fourth quadrants that approaches the positive y-axis asymptotically as \(x \to 0^+\), passes through \((1, 0)\), \((2, -1)\), and \((4, -2)\), and continues to decrease as \(x\) increases.