QUESTION IMAGE
Question
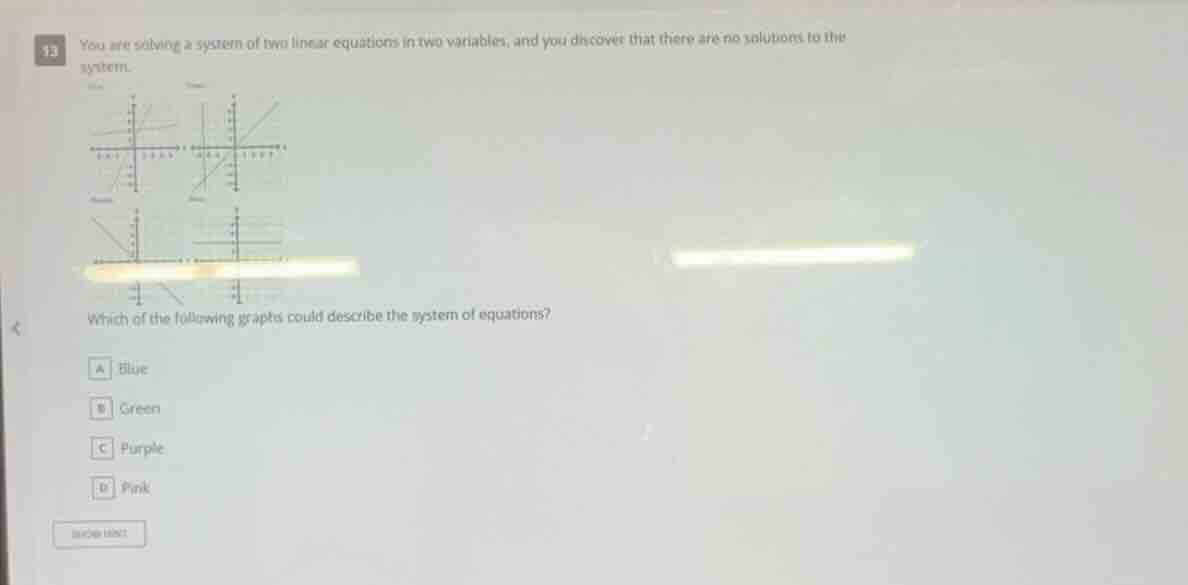
13 you are solving a system of two linear equations in two variables, and you discover that there are no solutions to the system. which of the following graphs could describe the system of equations? a blue b green c purple d pink
Step1: Recall the condition for no solution
A system of two linear equations in two variables has no solution when the two lines are parallel (same slope, different y - intercepts). So we need to identify the graph where the two lines are parallel (never intersect).
Step2: Analyze the options (assuming the graphs: typically, parallel lines are either both horizontal, both vertical, or have the same slope and different y - intercepts. For example, if one of the graphs (say Pink) shows two parallel lines (e.g., two horizontal lines with different y - values or two lines with same slope and different y - intercepts), while others show intersecting lines (Blue, Green, Purple might have intersecting lines or coinciding lines). Coinciding lines have infinitely many solutions, intersecting lines have one solution. So the graph with parallel lines (no intersection) is the one that represents the system with no solution.

Snap & solve any problem in the app
Get step-by-step solutions on Sovi AI
Photo-based solutions with guided steps
Explore more problems and detailed explanations
D. Pink (assuming that the Pink graph shows two parallel lines. If the actual graphs: for a system with no solution, the two lines must be parallel. So the option with parallel lines (e.g., two horizontal lines with different y - coordinates, two vertical lines with different x - coordinates, or two lines with same slope and different y - intercepts) is the correct one. Based on typical problems, the graph with parallel lines (no intersection) is the answer, and if the options are as given and Pink is the one with parallel lines, then the answer is D. Pink)