QUESTION IMAGE
Question
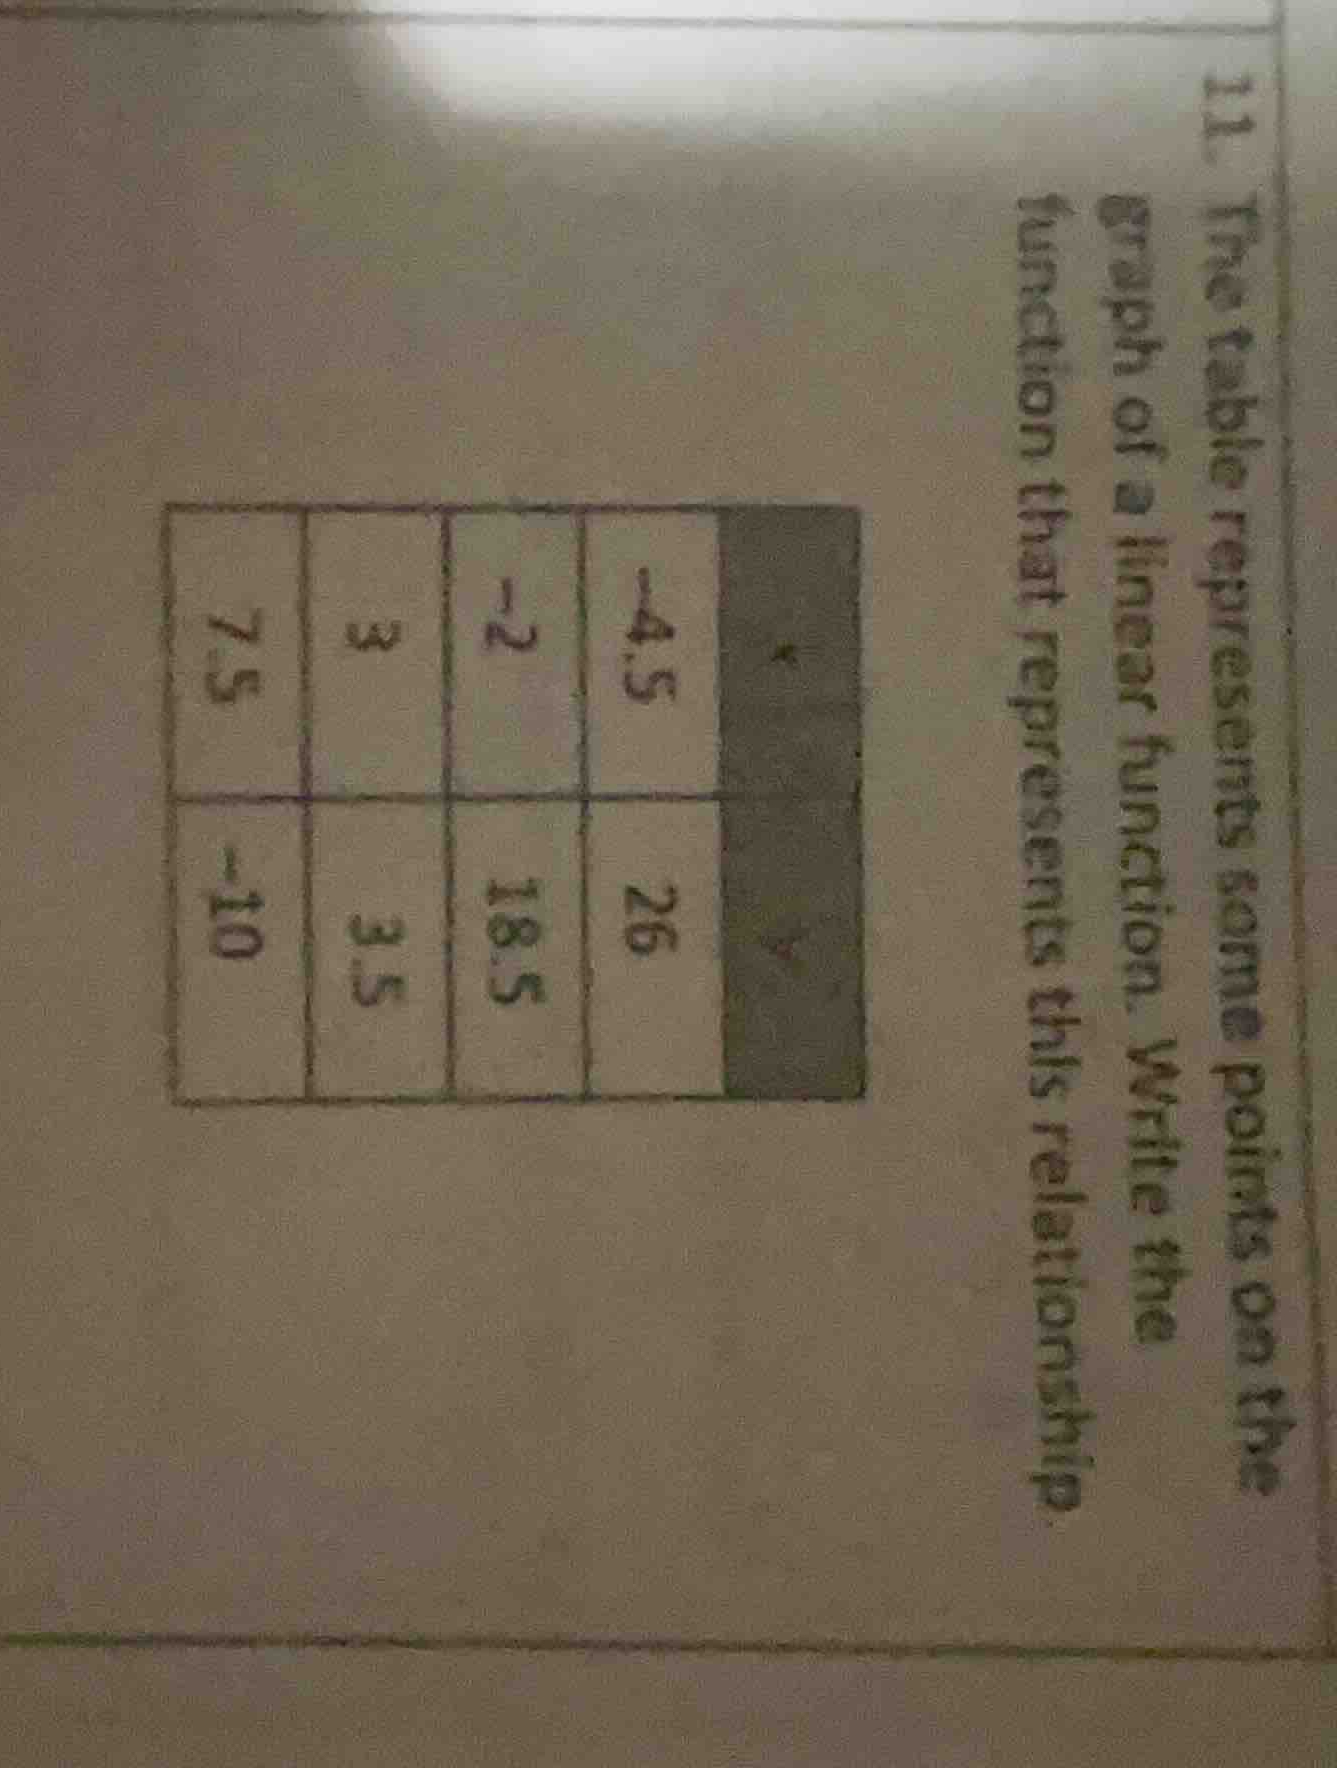
- the table represents some points on the graph of a linear function. write the function that represents this relationship.
\
$$\begin{array}{|c|c|}
\\hline
x & y \\\\
\\hline
-4.5 & 26 \\\\
\\hline
-2 & 18.5 \\\\
\\hline
3 & 3.5 \\\\
\\hline
7.5 & -10 \\\\
\\hline
\\end{array}$$
Calculate the slope of the linear function
$$
m = \frac{y_2 - y_1}{x_2 - x_1} = \frac{18.5 - 26}{-2 - (-4.5)} = \frac{-7.5}{2.5} = -3
$$
Determine the y-intercept using a point
$$
LATEXBLOCK0
$$
Write the final linear equation
$$
y = -3x + 12.5
$$

Snap & solve any problem in the app
Get step-by-step solutions on Sovi AI
Photo-based solutions with guided steps
Explore more problems and detailed explanations
\(y = -3x + 12.5\)