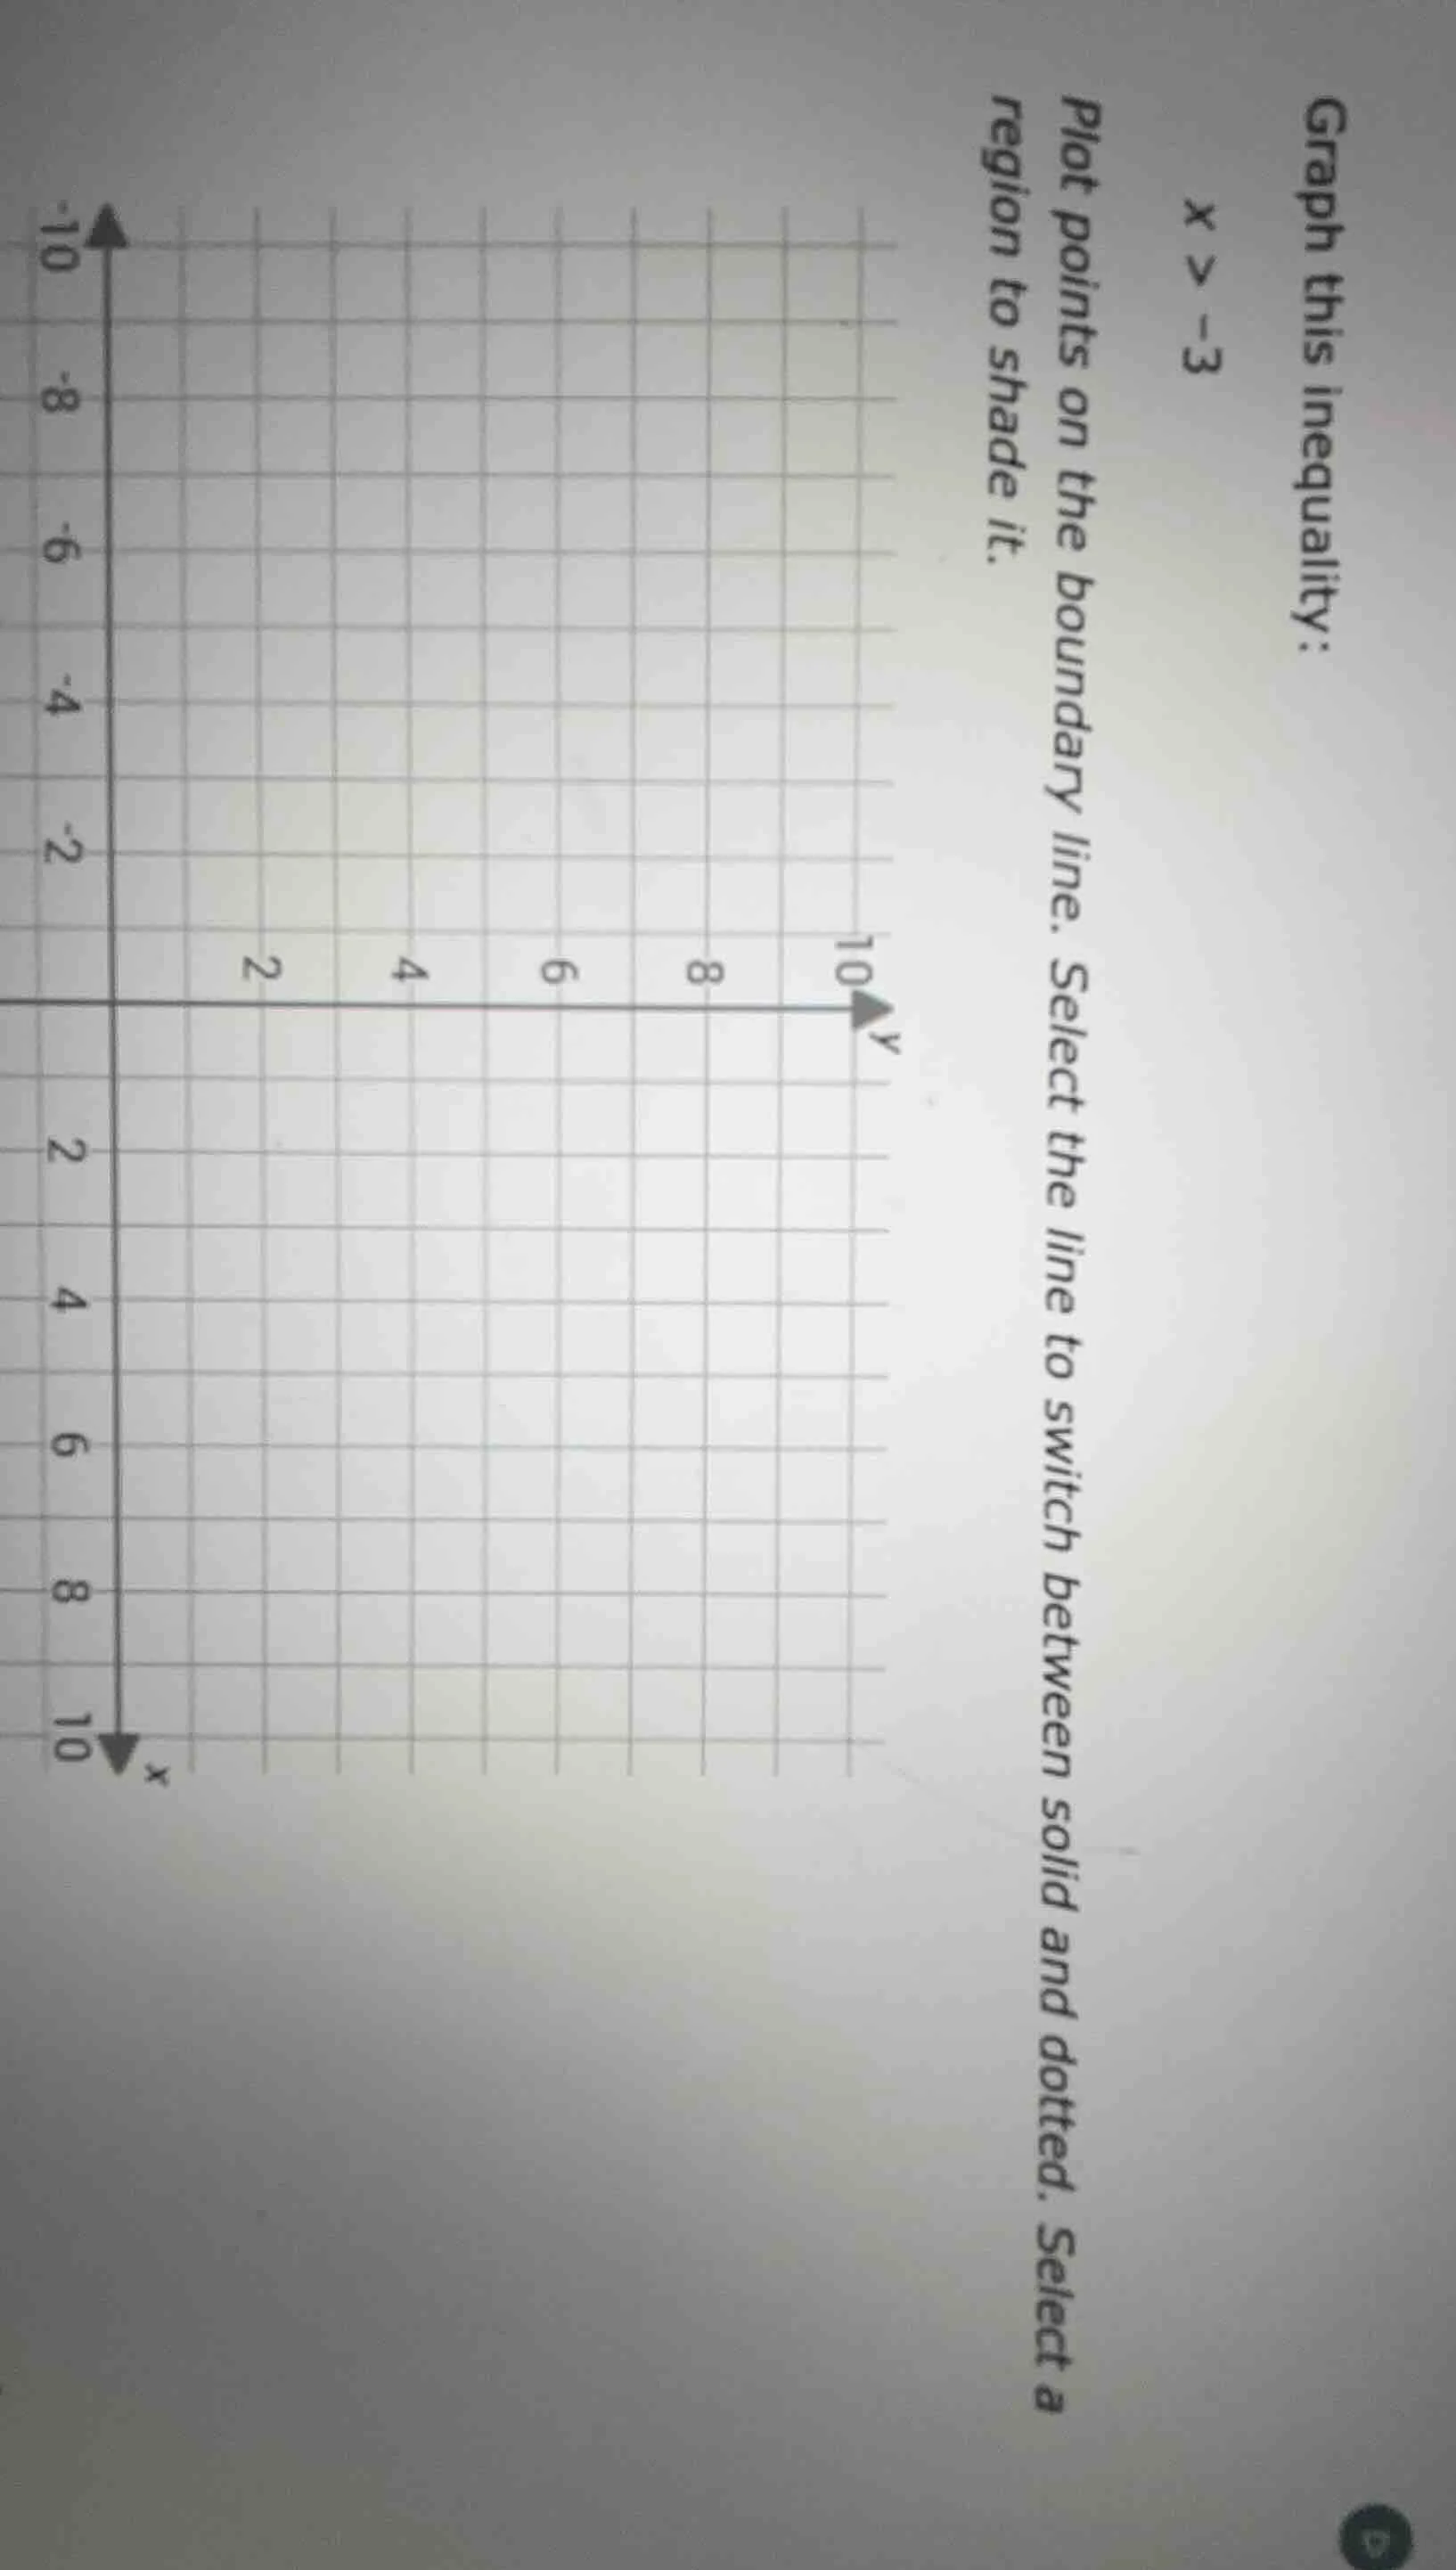
QUESTION IMAGE
Question
graph this inequality:
$x > -3$
plot points on the boundary line. select the line to switch between solid and dotted. select a region to shade it.
Step1: Identify boundary line
The boundary of $x > -3$ is the vertical line $x=-3$. Since the inequality is strict ($>$), the line is dotted (points on the line are not included).
Step2: Plot boundary points
Points on $x=-3$ include $(-3, -10), (-3, 0), (-3, 10)$ (any $y$-value works, as $x$ is fixed at $-3$).
Step3: Determine shaded region
The inequality $x > -3$ means all points where the $x$-coordinate is greater than $-3$. This is the region to the right of the dotted line $x=-3$.

Snap & solve any problem in the app
Get step-by-step solutions on Sovi AI
Photo-based solutions with guided steps
Explore more problems and detailed explanations
- Draw a vertical dotted line through $x=-3$ (plotting points like $(-3, -10)$, $(-3, 0)$, $(-3, 10)$ to form the line).
- Shade all area on the coordinate plane where $x > -3$ (the region to the right of the dotted line).