QUESTION IMAGE
Question
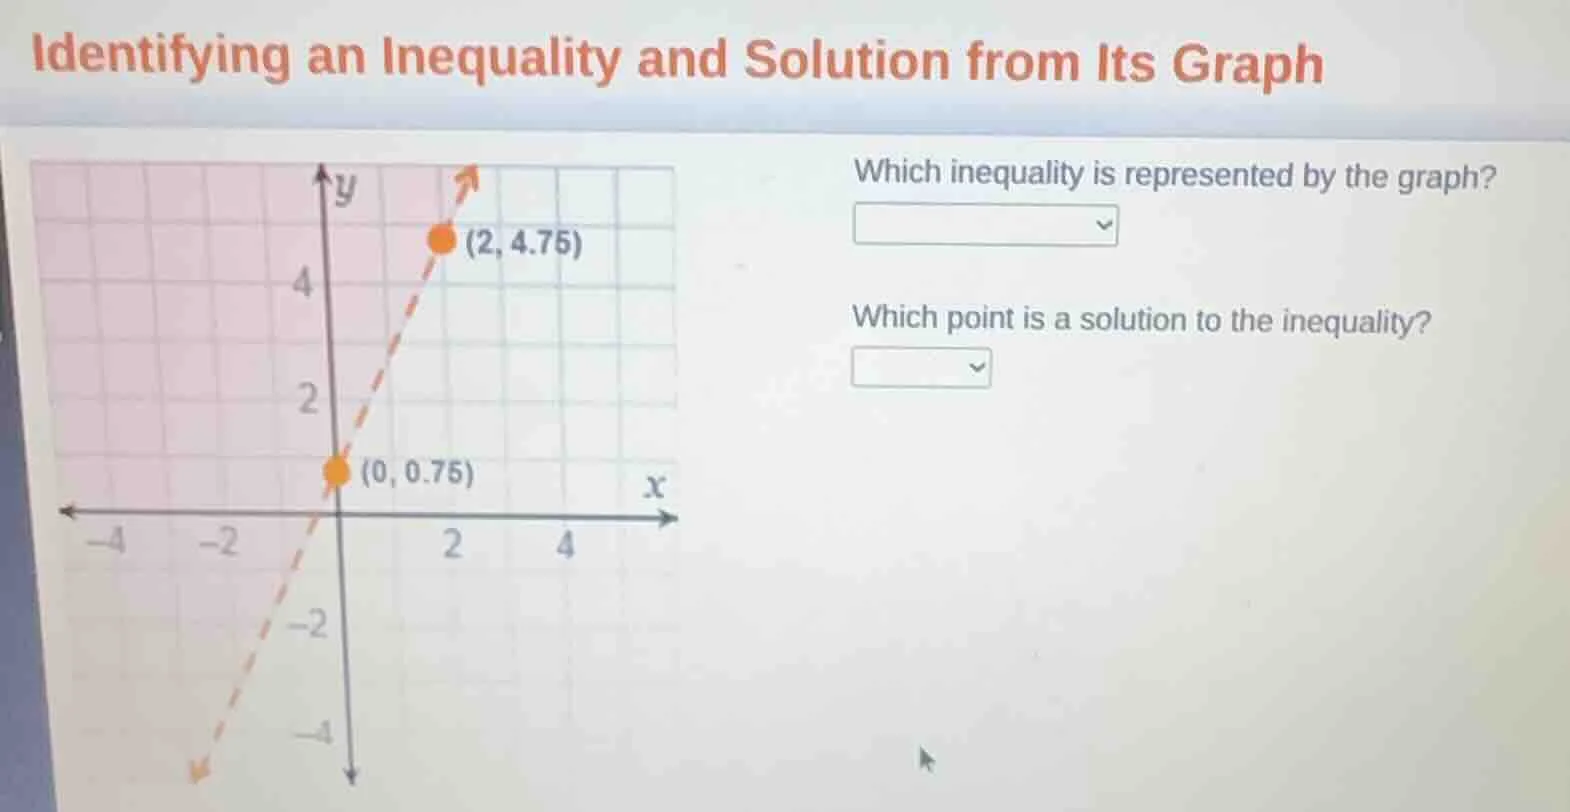
identifying an inequality and solution from its graph
which inequality is represented by the graph?
which point is a solution to the inequality?
graph: a coordinate plane with a dashed line passing through (0, 0.75) and (2, 4.75), shaded above the line. points (0, 0.75) and (2, 4.75) are marked with orange dots.
Step1: Find the slope of the line
The two points on the line are \((0, 0.75)\) and \((2, 4.75)\). The slope \(m\) is calculated as \(m=\frac{y_2 - y_1}{x_2 - x_1}=\frac{4.75 - 0.75}{2 - 0}=\frac{4}{2} = 2\).
Step2: Find the equation of the line
Using the slope - intercept form \(y=mx + b\), where \(m = 2\) and \(b=0.75\) (from the point \((0,0.75)\)), the equation of the line is \(y = 2x+0.75\).
Step3: Determine the inequality
The line is dashed (so the inequality is either \(y>2x + 0.75\) or \(y<2x + 0.75\)) and the shaded region is above the line. So the inequality is \(y>2x + 0.75\).
Step4: Find a solution point
We can test points. Let's consider the point \((0,1)\). Substitute \(x = 0\) and \(y=1\) into the inequality \(y>2x+0.75\): \(1>2(0)+0.75\) (i.e., \(1 > 0.75\)) which is true. So \((0,1)\) is a solution.

Snap & solve any problem in the app
Get step-by-step solutions on Sovi AI
Photo-based solutions with guided steps
Explore more problems and detailed explanations
The inequality represented by the graph is \(y>2x + 0.75\). A point that is a solution to the inequality is \((0,1)\) (other valid points can also be chosen as long as they satisfy the inequality).