QUESTION IMAGE
Question
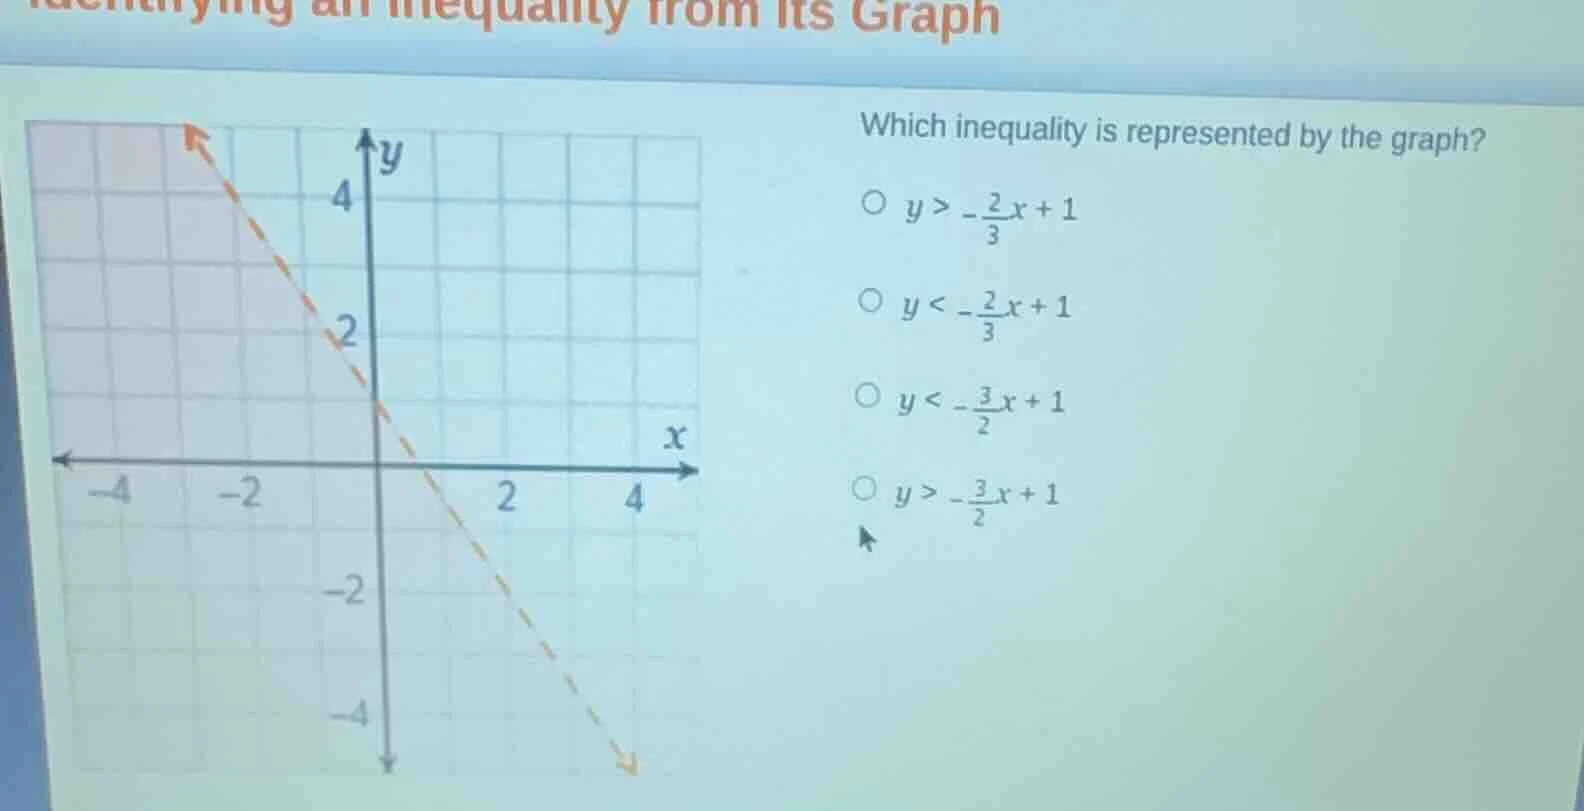
identifying an inequality from its graph
which inequality is represented by the graph?
$\circ\\ y > -\frac{2}{3}x + 1$
$\circ\\ y < -\frac{2}{3}x + 1$
$\circ\\ y < -\frac{3}{2}x + 1$
$\circ\\ y > -\frac{3}{2}x + 1$
Step1: Find the slope of the line
The line passes through \((0, 1)\) and \((3, -1)\) (we can find two points on the dashed line). The slope \(m=\frac{y_2 - y_1}{x_2 - x_1}=\frac{-1 - 1}{3 - 0}=\frac{-2}{3}\). So the equation of the line is \(y = -\frac{2}{3}x + 1\).
Step2: Determine the inequality symbol
The shaded region is above the dashed line. For a dashed line, the inequality is either \(y >\) or \(y <\). Since the shaded area is above the line, we use \(y >\) (because above the line means the \(y\)-values are greater than the line's \(y\)-values for a given \(x\)). So the inequality is \(y > -\frac{2}{3}x + 1\).

Snap & solve any problem in the app
Get step-by-step solutions on Sovi AI
Photo-based solutions with guided steps
Explore more problems and detailed explanations
\(y > -\frac{2}{3}x + 1\) (the first option: \(y > -\frac{2}{3}x + 1\))